Skip to content
Facts CountEdition: PortsmouthChange place
or browse all wards

Find your area

Portsmouth · GP surgeries and primary care · part of Health

GPs, dentists and pharmacies in Portsmouth

The short answer

Fully qualified GPs per 100,000 registered patients in Portsmouth GP practices: 37 per 100,000 registered (September 2026), 9.6 per 100,000 registered patients lower than England (46.5), calculated from unrounded figures; down 15 per 100,000 registered patients since September 2015 (51.8).

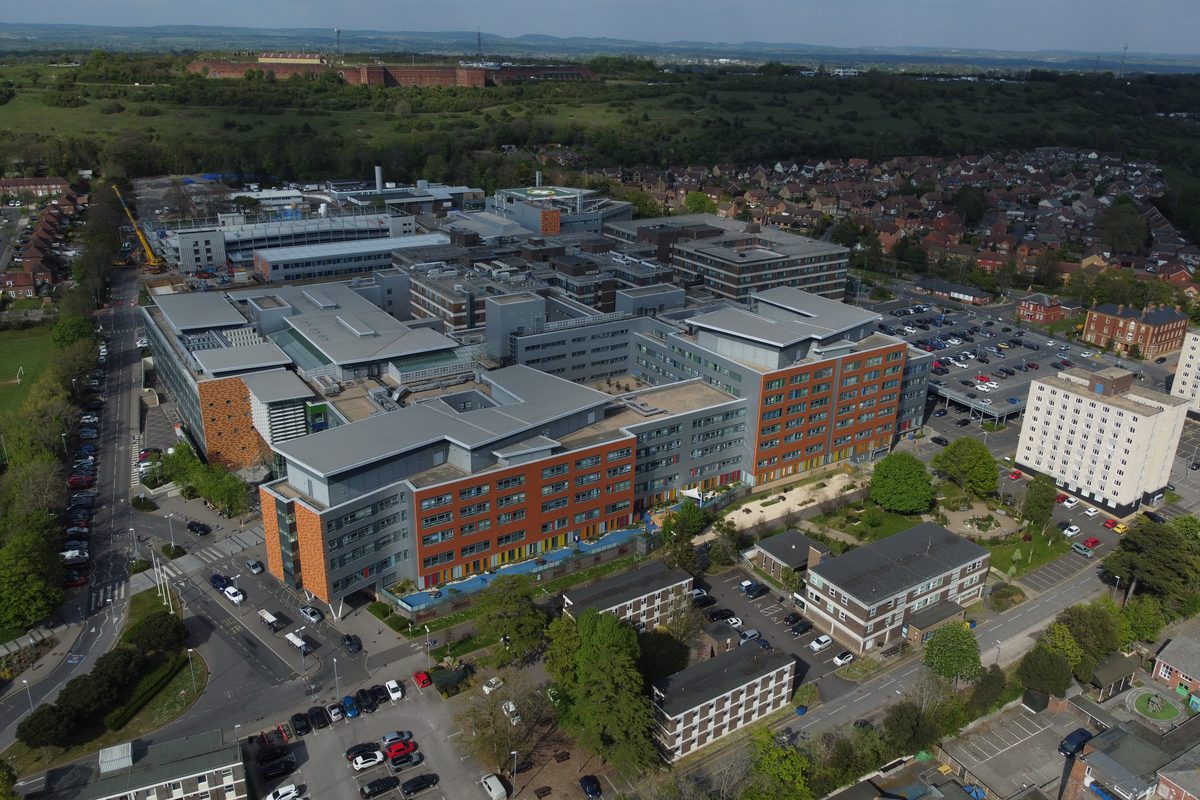
Aerial view of Queen Alexandra Hospital in Cosham: large brick and grey ward blocks, car parks and trees, with Portsdown Hill and Fort Widley behind
Queen Alexandra Hospital, Cosham, from the air. Photo: Tim Sheerman-Chase, CC BY 2.0, via Wikimedia Commons

Fully qualified GPs per 100,000 registered patients: how Portsmouth compares

How many family doctors (full-time equivalent) are there for every 100,000 people registered with the city's GP practices, and how has that changed since 2015?

Area covered: Practices in NHS sub-ICB location 10R (formerly NHS Portsmouth CCG), whose area matches Portsmouth City Council. Counts people registered with these practices, not residents.

Official statistics

Fully qualified GPs per 100,000 registered patients

September 2015 to September 2026

Portsmouth GP practices · full-time equivalent GPs per 100,000 registered patients

Reviewed figures: September 2015 to September 2026.

Shown on this chart: From September 2015 to September 2026, fully qualified GPs per 100,000 registered patients fell by 28.7% in Portsmouth GP practices and fell by 9.2% in England.

Both places compared over September 2015 to September 2026, using matching published dates.

Compared areas: Portsmouth GP practices; All GP practices in England..

Actual values

Portsmouth GP practicesEngland

Each line joins consecutive published observations for that place. Missing dates remain gaps.

  • 11 number of GP practices (September 2026)
  • 20,875 average registered patients per GP practice (September 2026)
The numbers over time (2)

Number of GP practices

Number of GP practices

September 2015 to September 2026

Portsmouth GP practices · practices

Reviewed figures: September 2015 to September 2026.

Shown on this chart: From September 2015 to September 2026, number of GP practices fell by 52.2% in Portsmouth GP practices and fell by 19.8% in England.

Both places compared over September 2015 to September 2026, using matching published dates.

Compared areas: Portsmouth GP practices; All GP practices in England..

Actual values

Portsmouth GP practicesEngland

Each line joins consecutive published observations for that place. Missing dates remain gaps.

Number of GP practices · practices
PeriodPortsmouth GP practicesSouthampton GP practicesEngland
September 202611 practices21 practices6,112 practices
September 202511 practices22 practices6,161 practices
September 202411 practices22 practices6,210 practices
September 202311 practices25 practices6,304 practices
September 202213 practices25 practices6,414 practices
September 202113 practices25 practices6,497 practices
September 202013 practices25 practices6,617 practices
September 201915 practices26 practices6,794 practices
September 201816 practices26 practices6,979 practices
September 201717 practices28 practices7,261 practices
September 201619 practices31 practices7,493 practices
September 201523 practices32 practices7,617 practices

Practices in the GP workforce files with at least one registered patient. A merger of two practices counts as one fewer practice even if no surgery building closes.

Average registered patients per GP practice

Average registered patients per GP practice

September 2015 to September 2026

Portsmouth GP practices · registered patients per practice

Reviewed figures: September 2015 to September 2026.

Shown on this chart: From September 2015 to September 2026, average registered patients per GP practice rose by 116.7% in Portsmouth GP practices and rose by 38% in England.

Both places compared over September 2015 to September 2026, using matching published dates.

Compared areas: Portsmouth GP practices; All GP practices in England..

Actual values

Portsmouth GP practicesEngland

Each line joins consecutive published observations for that place. Missing dates remain gaps.

Average registered patients per GP practice · registered patients per practice
PeriodPortsmouth GP practicesSouthampton GP practicesEngland
September 202620,875 registered patients per practice15,833 registered patients per practice10,309 registered patients per practice
September 202521,312 registered patients per practice15,332 registered patients per practice10,374 registered patients per practice
September 202421,397 registered patients per practice15,217 registered patients per practice10,237 registered patients per practice
September 202321,294 registered patients per practice13,099 registered patients per practice9,960 registered patients per practice
September 202217,773 registered patients per practice12,448 registered patients per practice9,659 registered patients per practice
September 202117,597 registered patients per practice11,603 registered patients per practice9,410 registered patients per practice
September 202017,740 registered patients per practice11,585 registered patients per practice9,127 registered patients per practice
September 201915,487 registered patients per practice11,175 registered patients per practice8,831 registered patients per practice
September 201814,420 registered patients per practice11,079 registered patients per practice8,504 registered patients per practice
September 201713,407 registered patients per practice10,177 registered patients per practice8,080 registered patients per practice
September 201611,350 registered patients per practice9,021 registered patients per practice7,720 registered patients per practice
September 20159,631 registered patients per practice8,563 registered patients per practice7,470 registered patients per practice

Registered patients divided by the number of practices, from the same GP workforce files.

See the full comparison data
Fully qualified GPs per 100,000 registered patients · full-time equivalent GPs per 100,000 registered patients
PeriodPortsmouth GP practicesSouthampton GP practicesEngland
September 202637 full-time equivalent GPs per 100,000 registered patients44.7 full-time equivalent GPs per 100,000 registered patients46.5 full-time equivalent GPs per 100,000 registered patients
September 202535.7 full-time equivalent GPs per 100,000 registered patients42.8 full-time equivalent GPs per 100,000 registered patients44.5 full-time equivalent GPs per 100,000 registered patients
September 202433.4 full-time equivalent GPs per 100,000 registered patients40.2 full-time equivalent GPs per 100,000 registered patients43.9 full-time equivalent GPs per 100,000 registered patients
September 202332.7 full-time equivalent GPs per 100,000 registered patients39.8 full-time equivalent GPs per 100,000 registered patients43.4 full-time equivalent GPs per 100,000 registered patients
September 202236 full-time equivalent GPs per 100,000 registered patients44.2 full-time equivalent GPs per 100,000 registered patients44.2 full-time equivalent GPs per 100,000 registered patients
September 202137.1 full-time equivalent GPs per 100,000 registered patients45.8 full-time equivalent GPs per 100,000 registered patients45.4 full-time equivalent GPs per 100,000 registered patients
September 202036.2 full-time equivalent GPs per 100,000 registered patients46.4 full-time equivalent GPs per 100,000 registered patients46.1 full-time equivalent GPs per 100,000 registered patients
September 201940.2 full-time equivalent GPs per 100,000 registered patients45.4 full-time equivalent GPs per 100,000 registered patients46.7 full-time equivalent GPs per 100,000 registered patients
September 201837.9 full-time equivalent GPs per 100,000 registered patients42.3 full-time equivalent GPs per 100,000 registered patients47.4 full-time equivalent GPs per 100,000 registered patients
September 201740.1 full-time equivalent GPs per 100,000 registered patients44.3 full-time equivalent GPs per 100,000 registered patients49.4 full-time equivalent GPs per 100,000 registered patients
September 201643.9 full-time equivalent GPs per 100,000 registered patients47.1 full-time equivalent GPs per 100,000 registered patients50.2 full-time equivalent GPs per 100,000 registered patients
September 201551.8 full-time equivalent GPs per 100,000 registered patients49.3 full-time equivalent GPs per 100,000 registered patients51.2 full-time equivalent GPs per 100,000 registered patients

Definition: Fully qualified GPs are all GPs except those still in GP training (registrars). Full-time equivalent (FTE) counts 37.5 hours a week as one GP, so two half-time GPs count as one. The rate is the sum of practice FTE divided by the sum of registered patients at the same practices, times 100,000. It is NHS England's own measure, built here from its practice-level files so that Portsmouth, Southampton and England use the same method.

  • This counts people registered with the practices, not city residents. Some people registered in Portsmouth live outside the city, and some residents are registered elsewhere.
  • GPs employed by primary care networks rather than practices, and ad-hoc locums, are not in these practice figures.
  • From February 2023 a practice that sends no valid staff records shows as "not available" instead of being estimated. Those practices are left out of both the GPs and the patients for that year (see the note on each figure).
  • England here is built from the practice files. NHS England's published England figure includes estimates for missing practices, so it can differ by about 0.1.
  • Other comparison cities not shown: Chichester is inside the wider NHS sub-ICB location 70F (NHS Surrey and Sussex ICB - 70F), which covers 7 council areas, so no GP practice group matches the city. Winchester is inside the wider NHS sub-ICB location D9Y0V (NHS Hampshire and Isle of Wight ICB - D9Y0V), which covers 13 council areas, so no GP practice group matches the city.

What the numbers do and don’t tell you

GPs are not the only people giving appointments

Since 2019 primary care networks have been able to claim back the pay of staff in 17 other roles, including clinical pharmacists, physiotherapists, paramedics, mental health practitioners and social prescribing link workers. These staff are not counted in the GP figures, and in England only around 44% of practice appointments in September 2026 were with a GP. GP numbers alone do not measure how easy it is to be seen.

Why GP lists can be bigger than the population

NHS England Digital calls it "list inflation": the register keeps people who should have been removed, such as people who moved away without telling their practice, emigrated or died, and some duplicate records. England's register exceeded the ONS population by almost 3.9 million in 2020. Members of the armed forces work the other way, being in the population but not the register.

Appointment waits are measured from booking, not from first asking

The appointments collection records the gap between the day an appointment was booked and the day it happened. NHS England says it does not represent all work in general practice. Someone who rang several times before getting a booking shows as a same-day appointment.

2 more notes, including long-run changes

The GP Patient Survey restarted its time series in 2024

Ipsos redesigned the questionnaire and moved to an online-first method in 2024, saying 2024 was the start of a new time series. Results from before and after 2024 are shown separately and should not be joined into one trend.

Measures by subject

Adults seen by an NHS dentist in the previous 24 months: ward by ward

Adults seen by an NHS dentist in the previous 24 months · % of adult population · 2026-06
WardValue
Copnor39.9%
Hilsea39.9%
Paulsgrove38.1%
Cosham37.7%
Nelson37.3%
Baffins36.8%
Drayton and Farlington35.7%
Fratton34.9%
Milton28.2%
Charles Dickens27.4%
St Thomas22.6%
Eastney and Craneswater21.9%
Central Southsea20.3%
St Jude18.5%

What is being done

Official commitments only, with their status from dated evidence. A completed action is not proof the figures above improved.

  • In progress Portsmouth City Council: Build a leisure and neighbourhood health hub at Bransbury Park with a 25-metre pool, learner pool, gym, studios and a GP surgery (replacing an existing practice). evidence 2026-10-05 ↗
  • Approved Department of Health and Social Care, through the Office for Students: Fund 25 new dental training places at the University of Portsmouth, training dentists from 2027 onwards. evidence 2026-06-03 ↗
  • Not verified Portsmouth City Council: Continue to advocate for improved primary care in Portsmouth, including GPs, dentists and community pharmacies, and where possible partner to bring provision forward. document ↗
  • Completed Portsmouth City Council: Restore and reopen Hilsea Lido. evidence 2026-10-17 ↗
  • In progress Portsmouth City Council with health and voluntary sector partners: Support unpaid carers through the Carers Strategy and its action plan across five priority areas, including a personalised respite and short-breaks offer. evidence 2025-12-08 ↗
  • In progress Portsmouth City Council with health partners: Deliver the Autism Strategic Action Plan 2025-2028 for autistic residents and their families. evidence 2025-12-08 ↗
  • Not verified Portsmouth City Council: Shape adult social care in Portsmouth through the Adult Social Care Strategy 2024-2027. document ↗
  • In progress Portsmouth City Council: Deliver the wider Hilsea Lines Linear Park around the reopened lido; separate from the lido reopening and from the coastal defence works at Hilsea Lines. evidence 2026-10-17 ↗
  • In progress Portsmouth City Council Public Health, with NHS Hampshire and Isle of Wight: Bring adult smoking down to 5% or less by 2030, with specialist stop-smoking support through the Portsmouth Wellbeing Service and commissioned services, including vapes through Swap to Stop, and more quits in groups with higher smoking rates. evidence 2026-06-17 ↗
  • In progress HIVE Portsmouth with Healthwatch Portsmouth: Run community helpdesks in Portsea (John Pounds Centre) and Paulsgrove (Paulsgrove Housing Office), giving residents in-person help to find health, care and community support. evidence 2025-12-10 ↗
  • In progress Portsmouth City Council with the University of Portsmouth and HIVE Portsmouth: Build the council’s capacity to use research on the wider causes of ill health, including community researchers and evidence to inform council decisions. evidence 2026-06 ↗

Trend, commitments and gaps for this issue →

Who can act

See what could change in Portsmouth → · Your councillors and MPs →

Support & Services

What we couldn’t find yet (5)

These figures would help residents but are not published for Portsmouth in a form we can check and refresh automatically.

  • GP numbers for people who live in Portsmouth (rather than people registered with Portsmouth practices). NHS England publishes GP workforce only by practice, primary care network, sub-ICB and ICB. There is no resident-based figure. Not held in this form. The practice-based figure for sub-ICB 10R is the closest official measure.
  • Waiting time from first contact to being seen, and unmet requests ("could not get an appointment"). The appointments collection only covers appointments that were booked. The GP Patient Survey asks about this, but only as patient recall. No national data source. Practice telephony and online-request data are held by individual practices and NHS Hampshire and Isle of Wight ICB; ask the ICB by FOI (https://www.hantsiow.icb.nhs.uk/) for any cloud telephony or online-consultation statistics it collects for Portsmouth practices.
  • Additional Roles (ARRS) staff working in Portsmouth primary care networks. NHS England Digital publishes primary care network workforce by PCN, which needs a separate collection and PCN-to-city mapping; it is not yet in this file. NHS England Digital "Primary Care Network Workforce" publication (PCN-level CSVs); Portsmouth PCNs can be taken from the practice map.
  • Southampton GP Patient Survey and phone-access figures before 2024. OHID Fingertips publishes the older series only for current sub-ICB areas, and Southampton has had no separate sub-ICB since April 2021. Ipsos published Southampton City CCG results for each wave up to 2021 (gp-patient.co.uk past results, CCG files); they use the older questionnaire and would need their own measure.
  • NHS dental access before April 2019. The NHSBSA monthly patients-seen table starts in April 2019. Earlier figures were published by NHS Digital on a different basis. NHS Digital NHS Dental Statistics for England annual reports 2006-07 to 2018-19 (patients seen by local authority), not joined here because of the change of method.
Sources and method

Comparison places are chosen automatically: the three nearest official cities, and the three most similar cities in the ONS area classification (cities whose council areas have a similar population make-up), plus England. Where a measure is only published for whole counties, cities inside a county are left out rather than replaced by the county.

Figures are fetched by a script from the official source and shown unchanged. Comparisons use the same definition and period for every place. Rates and shares change in percentage points; counts and levels change in per cent. An increase is not automatically good or bad.

All the data in this topic

The retained source collection contains 0 records for this topic, including comparison areas and older releases. Each record keeps its own period and source date. Current findings above may use newer releases; a later page update does not refresh every record.

Browse 0 measures and their sources

Source downloads and methods →