
Skip to content
Facts CountEdition: PortsmouthChange place
or browse all wards

Find your area

Portsmouth’s estimated emissions per resident have more than halved since 2005

Territorial greenhouse gas emissions fell from 7.18 to 3.05 tonnes CO₂ equivalent per resident between 2005 and 2024. This is not each resident’s personal carbon footprint.

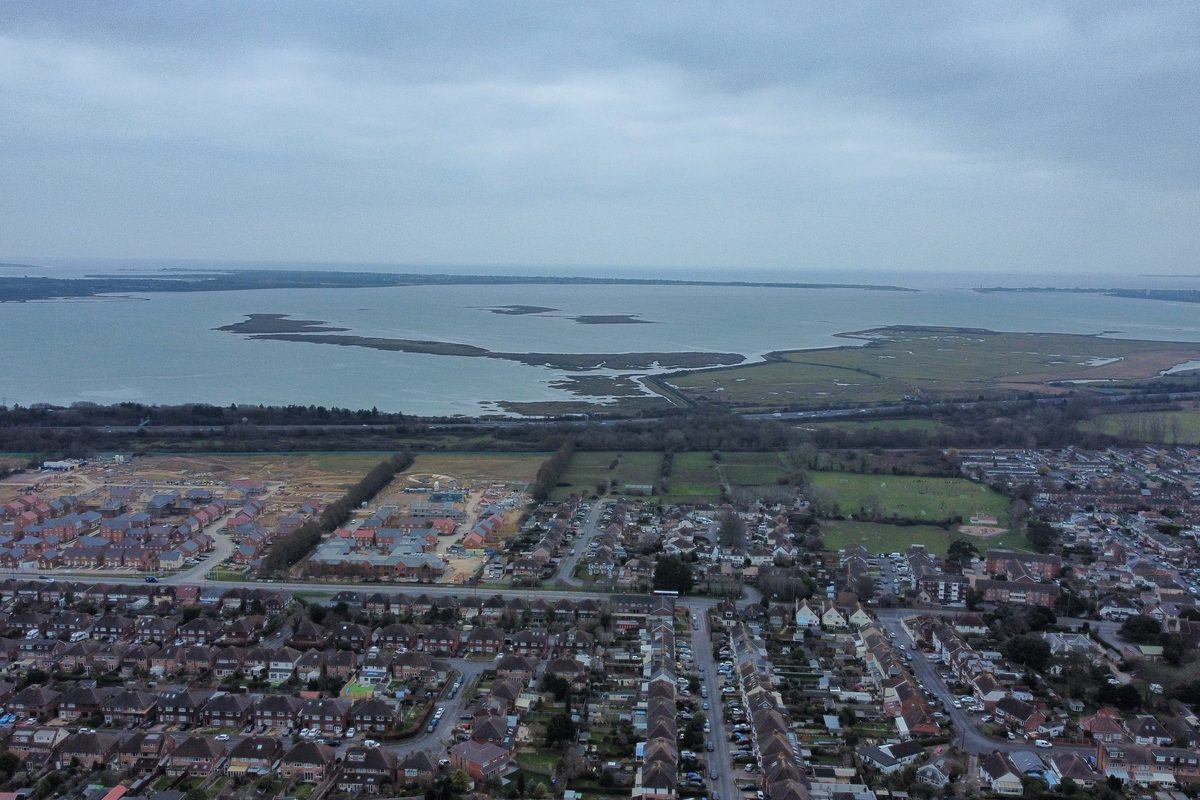
Aerial view over Drayton and Farlington houses towards Farlington Marshes and Langstone Harbour, with North Binness, Long and Baker's islands in the water
Langstone Harbour and Farlington Marshes from the air. Photo: Tim Sheerman-Chase, CC BY 2.0, via Wikimedia Commons
Figures and sources

More local evidence

Fly-tipping incidents recorded by the council

937

incidents · Portsmouth · 2024/25

The annual count reflects both dumping and how it is reported and recorded.

Why this matters and what could help →

Fly-tipping incidents recorded by the council each year. Portsmouth local authority.

Show the workings

Annual nitrogen dioxide at London Road

28

µg/m³ · London Road automatic monitoring station · 2025

One monitoring site cannot describe exposure on every street.

Why this matters and what could help →

A measured concentration at this monitoring station, not a citywide average. Gatcombe Park is the urban-background station; other stations represent roadside or kerbside conditions.

Show the workings

Properties in the high river or sea flood-risk band

2,849

properties · Portsmouth local authority · June 2026

Modelled flood exposure is a planning measure, not a prediction that each property will flood.

The wider figure is 11,827 properties across all mapped river or sea risk bands, including very low risk. It is not a count of properties in the high-risk band.

Why this matters and what could help →

Modelled risk of flooding from rivers and sea, allowing for flood defences; excludes surface-water and groundwater flooding. Includes residential, non-residential and unclassified properties from the National Receptor Dataset 2023. June 2026 risk model, not a count of properties flooded. At least a 3.3% annual chance. Display rounded to the nearest 10; source value retained.

Show the workings

Properties in mapped river or sea flood-risk bands

11,827

properties · Portsmouth local authority · June 2026

This includes very low, low, medium and high risk; it is not the high-risk count.

Of the wider group, 2,849 properties are in the high river or sea flood-risk band. The figures are modelled exposure, not predicted individual floods.

Why this matters and what could help →

Modelled risk of flooding from rivers and sea, allowing for flood defences; excludes surface-water and groundwater flooding. Includes residential, non-residential and unclassified properties from the National Receptor Dataset 2023. June 2026 risk model, not a count of properties flooded. Includes the very-low likelihood band. Display rounded to the nearest 10; source value retained.

Show the workings

Storm-overflow spills at Henderson Road, Eastney

86

spills · Henderson Road Eastney Cso · 2025

A spill count measures recorded discharges, not their volume or every pollution source.

Why this matters and what could help →

Named outfall (SWS00416), discharging to THE SOLENT; not a city or harbour total. Spill count uses EA 12/24-hour method. Duration is monitored discharge time, not sewage volume or a real-time bathing safety result. Monitor operational for 97.52% of reporting period.

Show the workings

Full evidence collections and historical data →

All the data in this topic

The retained source collection contains 73 records for this topic, including comparison areas and older releases. Each record keeps its own period and source date. Current findings above may use newer releases; a later page update does not refresh every record.

Browse 65 measures and their sources
Recorded fly-tipping incidents
Recorded fly-tipping incidents · retained published records
Area and periodFigureDefinition, source and limits
Portsmouth
2024/25
937 incidents

Fly-tipping incidents recorded by the council each year. Portsmouth local authority.

Defra ↗Source retrieved 2026-09-23
Bathing water classification
Bathing water classification · retained published records
Area and periodFigureDefinition, source and limits
Portsmouth
Southsea East, 2025 classification
Poor

Environment Agency annual rating for Southsea East beach. Southsea East sampling point.

Environment Agency ↗Source retrieved 2026-09-23
Gatcombe Park annual NO₂
Gatcombe Park annual NO₂ · retained published records
Area and periodFigureDefinition, source and limits
Portsmouth
2025
14.93 µg/m³

A measured concentration at this monitoring station, not a citywide average. Gatcombe Park is the urban-background station; other stations represent roadside or kerbside conditions.

Portsmouth City Council ↗Source retrieved 2026-10-03
Portsmouth
2025
14.93 µg/m³

A measured concentration at this monitoring station, not a citywide average. Gatcombe Park is the urban-background station; other stations represent roadside or kerbside conditions.

Portsmouth City Council ↗Source retrieved 2026-10-03
Local bus passenger journeys
Local bus passenger journeys · retained published records
Area and periodFigureDefinition, source and limits
Portsmouth
year to March 2025
11.9m journeys

Bus journeys taken across Portsmouth each year. Portsmouth local authority.

DfT ↗Source retrieved 2026-09-23
Police-recorded crime, all offences, year-on-year change
Police-recorded crime, all offences, year-on-year change · retained published records
Area and periodFigureDefinition, source and limits
Portsmouth
year to March 2026 against year to March 2025
-1.4%

Change in police-recorded crime year on year. Portsmouth community safety partnership area.

ONS Police Force Area data tables, year ending March 2026 (Tables C3, C4) ↗Source retrieved 2026-09-23
Vacant retail units, city centre
Vacant retail units, city centre · retained published records
Area and periodFigureDefinition, source and limits
Portsmouth
Retail Study Update 2024
16.4%

Empty retail units as a share of the city-centre survey area. Portsmouth city centre survey boundary.

Portsmouth City Council ↗Source retrieved 2026-09-23
Residents in employment cycling to work
Residents in employment cycling to work · retained published records
Area and periodFigureDefinition, source and limits
Portsmouth
Census 2021
5.2%

Residents in work who travel by bicycle. Portsmouth local authority.

ONS / Portsmouth City Council LCWIP ↗Source retrieved 2026-09-23
Asylum seekers in receipt of Home Office support
Asylum seekers in receipt of Home Office support · retained published records
Area and periodFigureDefinition, source and limits
Portsmouth
receiving support, September 2024
733

People in Portsmouth receiving Home Office asylum support. Portsmouth local authority.

Portsmouth City Council / Home Office ↗Source retrieved 2026-09-23
Bathing water classification — Eastney
Bathing water classification — Eastney · retained published records
Area and periodFigureDefinition, source and limits
Portsmouth
2025 classification
Good

Environment Agency annual bathing water classification (Excellent, Good, Sufficient, Poor) under the Bathing Water Regulations.

Environment Agency ↗Source retrieved 2026-09-23
Recorded crime rate
Recorded crime rate · retained published records
Area and periodFigureDefinition, source and limits
Portsmouth
Year ending March 2026
112.7

24,163 offences; ONS rates use mid-2024 population (214,300). 3,316 Hampshire offences were not allocated to any area.

ONS ↗Source retrieved 2026-09-23
London Road annual NO₂
London Road annual NO₂ · retained published records
Area and periodFigureDefinition, source and limits
Portsmouth
2025
27.97 µg/m³

A measured concentration at this monitoring station, not a citywide average. Gatcombe Park is the urban-background station; other stations represent roadside or kerbside conditions.

Portsmouth City Council ↗Source retrieved 2026-10-03
Portsmouth
2025
27.97 µg/m³

A measured concentration at this monitoring station, not a citywide average. Gatcombe Park is the urban-background station; other stations represent roadside or kerbside conditions.

Portsmouth City Council ↗Source retrieved 2026-10-03
NO₂ annual mean — London Road
NO₂ annual mean — London Road · retained published records
Area and periodFigureDefinition, source and limits
Portsmouth
2025
27.97 µg/m³

A measured concentration at this monitoring station, not a citywide average. Gatcombe Park is the urban-background station; other stations represent roadside or kerbside conditions.

Portsmouth City Council ↗Source retrieved 2026-10-03
PM10 annual mean — London Road
PM10 annual mean — London Road · retained published records
Area and periodFigureDefinition, source and limits
Portsmouth
2025
19.08 µg/m³

A measured concentration at this monitoring station, not a citywide average. Gatcombe Park is the urban-background station; other stations represent roadside or kerbside conditions.

Portsmouth City Council ↗Source retrieved 2026-10-03
PM₂.₅ annual mean — London Road
PM₂.₅ annual mean — London Road · retained published records
Area and periodFigureDefinition, source and limits
Portsmouth
2025
11.61 µg/m³

A measured concentration at this monitoring station, not a citywide average. Gatcombe Park is the urban-background station; other stations represent roadside or kerbside conditions.

Portsmouth City Council ↗Source retrieved 2026-10-03
NO₂ annual mean — Gatcombe Park
NO₂ annual mean — Gatcombe Park · retained published records
Area and periodFigureDefinition, source and limits
Portsmouth
2025
14.93 µg/m³

A measured concentration at this monitoring station, not a citywide average. Gatcombe Park is the urban-background station; other stations represent roadside or kerbside conditions.

Portsmouth City Council ↗Source retrieved 2026-10-03
PM10 annual mean — Gatcombe Park
PM10 annual mean — Gatcombe Park · retained published records
Area and periodFigureDefinition, source and limits
Portsmouth
2025
13.91 µg/m³

A measured concentration at this monitoring station, not a citywide average. Gatcombe Park is the urban-background station; other stations represent roadside or kerbside conditions.

Portsmouth City Council ↗Source retrieved 2026-10-03
PM₂.₅ annual mean — Gatcombe Park
PM₂.₅ annual mean — Gatcombe Park · retained published records
Area and periodFigureDefinition, source and limits
Portsmouth
2025
8.38 µg/m³

A measured concentration at this monitoring station, not a citywide average. Gatcombe Park is the urban-background station; other stations represent roadside or kerbside conditions.

Portsmouth City Council ↗Source retrieved 2026-10-03
NO₂ annual mean — Burrfields Road
NO₂ annual mean — Burrfields Road · retained published records
Area and periodFigureDefinition, source and limits
Portsmouth
2025
23.16 µg/m³

A measured concentration at this monitoring station, not a citywide average. Gatcombe Park is the urban-background station; other stations represent roadside or kerbside conditions.

Portsmouth City Council ↗Source retrieved 2026-10-03
PM10 annual mean — Burrfields Road
PM10 annual mean — Burrfields Road · retained published records
Area and periodFigureDefinition, source and limits
Portsmouth
2025
16.20 µg/m³

A measured concentration at this monitoring station, not a citywide average. Gatcombe Park is the urban-background station; other stations represent roadside or kerbside conditions.

Portsmouth City Council ↗Source retrieved 2026-10-03
PM₂.₅ annual mean — Burrfields Road
PM₂.₅ annual mean — Burrfields Road · retained published records
Area and periodFigureDefinition, source and limits
Portsmouth
2025
10.03 µg/m³

A measured concentration at this monitoring station, not a citywide average. Gatcombe Park is the urban-background station; other stations represent roadside or kerbside conditions.

Portsmouth City Council ↗Source retrieved 2026-10-03
NO₂ annual mean — Mile End Road
NO₂ annual mean — Mile End Road · retained published records
Area and periodFigureDefinition, source and limits
Portsmouth
2025
22.77 µg/m³

A measured concentration at this monitoring station, not a citywide average. Gatcombe Park is the urban-background station; other stations represent roadside or kerbside conditions.

Portsmouth City Council ↗Source retrieved 2026-10-03
PM10 annual mean — Mile End Road
PM10 annual mean — Mile End Road · retained published records
Area and periodFigureDefinition, source and limits
Portsmouth
2025
15.80 µg/m³

A measured concentration at this monitoring station, not a citywide average. Gatcombe Park is the urban-background station; other stations represent roadside or kerbside conditions.

Portsmouth City Council ↗Source retrieved 2026-10-03
PM₂.₅ annual mean — Mile End Road
PM₂.₅ annual mean — Mile End Road · retained published records
Area and periodFigureDefinition, source and limits
Portsmouth
2025
9.80 µg/m³

A measured concentration at this monitoring station, not a citywide average. Gatcombe Park is the urban-background station; other stations represent roadside or kerbside conditions.

Portsmouth City Council ↗Source retrieved 2026-10-03
NO₂ annual mean — Anglesea Road
NO₂ annual mean — Anglesea Road · retained published records
Area and periodFigureDefinition, source and limits
Portsmouth
2025
21.63 µg/m³

A measured concentration at this monitoring station, not a citywide average. Gatcombe Park is the urban-background station; other stations represent roadside or kerbside conditions.

Portsmouth City Council ↗Source retrieved 2026-10-03
PM10 annual mean — Anglesea Road
PM10 annual mean — Anglesea Road · retained published records
Area and periodFigureDefinition, source and limits
Portsmouth
2025
14.49 µg/m³

A measured concentration at this monitoring station, not a citywide average. Gatcombe Park is the urban-background station; other stations represent roadside or kerbside conditions.

Portsmouth City Council ↗Source retrieved 2026-10-03
PM₂.₅ annual mean — Anglesea Road
PM₂.₅ annual mean — Anglesea Road · retained published records
Area and periodFigureDefinition, source and limits
Portsmouth
2025
8.63 µg/m³

A measured concentration at this monitoring station, not a citywide average. Gatcombe Park is the urban-background station; other stations represent roadside or kerbside conditions.

Portsmouth City Council ↗Source retrieved 2026-10-03
NO₂ annual mean — Alfred Road
NO₂ annual mean — Alfred Road · retained published records
Area and periodFigureDefinition, source and limits
Portsmouth
2025
35.40 µg/m³

A measured concentration at this monitoring station, not a citywide average. Gatcombe Park is the urban-background station; other stations represent roadside or kerbside conditions.

Portsmouth City Council ↗Source retrieved 2026-10-03
PM10 annual mean — Alfred Road
PM10 annual mean — Alfred Road · retained published records
Area and periodFigureDefinition, source and limits
Portsmouth
2025
20.01 µg/m³

A measured concentration at this monitoring station, not a citywide average. Gatcombe Park is the urban-background station; other stations represent roadside or kerbside conditions.

Portsmouth City Council ↗Source retrieved 2026-10-03
PM₂.₅ annual mean — Alfred Road
PM₂.₅ annual mean — Alfred Road · retained published records
Area and periodFigureDefinition, source and limits
Portsmouth
2025
10.75 µg/m³

A measured concentration at this monitoring station, not a citywide average. Gatcombe Park is the urban-background station; other stations represent roadside or kerbside conditions.

Portsmouth City Council ↗Source retrieved 2026-10-03
NO₂ diffusion-tube locations
NO₂ diffusion-tube locations · retained published records
Area and periodFigureDefinition, source and limits
Portsmouth
2025
228

Excludes six co-location sites.

Portsmouth City Council ↗Source retrieved 2026-10-03
NO₂ diffusion-tube sites increasing since 2024
NO₂ diffusion-tube sites increasing since 2024 · retained published records
Area and periodFigureDefinition, source and limits
Portsmouth
2024 to 2025
77.19%

176 of 228 sites. Weather and other factors affect year-to-year results; the longer-term trend was downward at most sites.

Portsmouth City Council ↗Source retrieved 2026-10-03
NO₂ annual mean — Alfred Road kerbside tube 118
NO₂ annual mean — Alfred Road kerbside tube 118 · retained published records
Area and periodFigureDefinition, source and limits
Portsmouth
2025
41.86 µg/m³

Above 40 µg/m³ at the monitoring location, but this location does not represent relevant long-term public exposure. The council reports no annual objective exceedance at relevant receptors.

Portsmouth City Council ↗Source retrieved 2026-10-03
Counted storm-overflow spills — Portswood Sso
Counted storm-overflow spills — Portswood Sso · retained published records
Area and periodFigureDefinition, source and limits
Southampton
2025
36

Named outfall (SWS00674), discharging to RIVER ITCHEN ESTUARY; not a city or harbour total. Spill count uses EA 12/24-hour method. Duration is monitored discharge time, not sewage volume or a real-time bathing safety result. Monitor operational for 99.91% of reporting period.

Environment Agency ↗Source retrieved 2026-10-03
Storm-overflow discharge duration — Portswood Sso
Storm-overflow discharge duration — Portswood Sso · retained published records
Area and periodFigureDefinition, source and limits
Southampton
2025
380.21 hours

Named outfall (SWS00674), discharging to RIVER ITCHEN ESTUARY; not a city or harbour total. Spill count uses EA 12/24-hour method. Duration is monitored discharge time, not sewage volume or a real-time bathing safety result. Monitor operational for 99.91% of reporting period.

Environment Agency ↗Source retrieved 2026-10-03
Storm-overflow monitor operability — Portswood Sso
Storm-overflow monitor operability — Portswood Sso · retained published records
Area and periodFigureDefinition, source and limits
Southampton
2025
99.91%

Named outfall (SWS00674), discharging to RIVER ITCHEN ESTUARY; not a city or harbour total. Spill count uses EA 12/24-hour method. Duration is monitored discharge time, not sewage volume or a real-time bathing safety result. Monitor operational for 99.91% of reporting period.

Environment Agency ↗Source retrieved 2026-10-03
Counted storm-overflow spills — Woolston Sso
Counted storm-overflow spills — Woolston Sso · retained published records
Area and periodFigureDefinition, source and limits
Southampton
2025
18

Named outfall (SWS00969), discharging to RIVER ITCHEN ESTUARY; not a city or harbour total. Spill count uses EA 12/24-hour method. Duration is monitored discharge time, not sewage volume or a real-time bathing safety result. Monitor operational for 99.14% of reporting period.

Environment Agency ↗Source retrieved 2026-10-03
Storm-overflow discharge duration — Woolston Sso
Storm-overflow discharge duration — Woolston Sso · retained published records
Area and periodFigureDefinition, source and limits
Southampton
2025
78.07 hours

Named outfall (SWS00969), discharging to RIVER ITCHEN ESTUARY; not a city or harbour total. Spill count uses EA 12/24-hour method. Duration is monitored discharge time, not sewage volume or a real-time bathing safety result. Monitor operational for 99.14% of reporting period.

Environment Agency ↗Source retrieved 2026-10-03
Storm-overflow monitor operability — Woolston Sso
Storm-overflow monitor operability — Woolston Sso · retained published records
Area and periodFigureDefinition, source and limits
Southampton
2025
99.14%

Named outfall (SWS00969), discharging to RIVER ITCHEN ESTUARY; not a city or harbour total. Spill count uses EA 12/24-hour method. Duration is monitored discharge time, not sewage volume or a real-time bathing safety result. Monitor operational for 99.14% of reporting period.

Environment Agency ↗Source retrieved 2026-10-03
Counted storm-overflow spills — Millbrook Sso
Counted storm-overflow spills — Millbrook Sso · retained published records
Area and periodFigureDefinition, source and limits
Southampton
2025
28

Named outfall (SWS00579), discharging to THE RIVER TEST; not a city or harbour total. Spill count uses EA 12/24-hour method. Duration is monitored discharge time, not sewage volume or a real-time bathing safety result. Monitor operational for 99.93% of reporting period.

Environment Agency ↗Source retrieved 2026-10-03
Storm-overflow discharge duration — Millbrook Sso
Storm-overflow discharge duration — Millbrook Sso · retained published records
Area and periodFigureDefinition, source and limits
Southampton
2025
439.17 hours

Named outfall (SWS00579), discharging to THE RIVER TEST; not a city or harbour total. Spill count uses EA 12/24-hour method. Duration is monitored discharge time, not sewage volume or a real-time bathing safety result. Monitor operational for 99.93% of reporting period.

Environment Agency ↗Source retrieved 2026-10-03
Storm-overflow monitor operability — Millbrook Sso
Storm-overflow monitor operability — Millbrook Sso · retained published records
Area and periodFigureDefinition, source and limits
Southampton
2025
99.93%

Named outfall (SWS00579), discharging to THE RIVER TEST; not a city or harbour total. Spill count uses EA 12/24-hour method. Duration is monitored discharge time, not sewage volume or a real-time bathing safety result. Monitor operational for 99.93% of reporting period.

Environment Agency ↗Source retrieved 2026-10-03
Counted storm-overflow spills — Lawn Road Southampton Cso
Counted storm-overflow spills — Lawn Road Southampton Cso · retained published records
Area and periodFigureDefinition, source and limits
Southampton
2025
11

Named outfall (SWS00497), discharging to ITCHEN ESTUARY; not a city or harbour total. Spill count uses EA 12/24-hour method. Duration is monitored discharge time, not sewage volume or a real-time bathing safety result. Monitor operational for 46.45% of reporting period. Incomplete monitoring: Sensor failure / issue. Counts and duration may understate activity.

Environment Agency ↗Source retrieved 2026-10-03
Storm-overflow discharge duration — Lawn Road Southampton Cso
Storm-overflow discharge duration — Lawn Road Southampton Cso · retained published records
Area and periodFigureDefinition, source and limits
Southampton
2025
48.85 hours

Named outfall (SWS00497), discharging to ITCHEN ESTUARY; not a city or harbour total. Spill count uses EA 12/24-hour method. Duration is monitored discharge time, not sewage volume or a real-time bathing safety result. Monitor operational for 46.45% of reporting period. Incomplete monitoring: Sensor failure / issue. Counts and duration may understate activity.

Environment Agency ↗Source retrieved 2026-10-03
Storm-overflow monitor operability — Lawn Road Southampton Cso
Storm-overflow monitor operability — Lawn Road Southampton Cso · retained published records
Area and periodFigureDefinition, source and limits
Southampton
2025
46.45%

Named outfall (SWS00497), discharging to ITCHEN ESTUARY; not a city or harbour total. Spill count uses EA 12/24-hour method. Duration is monitored discharge time, not sewage volume or a real-time bathing safety result. Monitor operational for 46.45% of reporting period. Incomplete monitoring: Sensor failure / issue. Counts and duration may understate activity.

Environment Agency ↗Source retrieved 2026-10-03
Counted storm-overflow spills — Fort Cumberland Road Eastney Sso
Counted storm-overflow spills — Fort Cumberland Road Eastney Sso · retained published records
Area and periodFigureDefinition, source and limits
Portsmouth
2025
9

Named outfall (SWS00325), discharging to LANGSTONE HARBOUR; not a city or harbour total. Spill count uses EA 12/24-hour method. Duration is monitored discharge time, not sewage volume or a real-time bathing safety result. Monitor operational for 99.81% of reporting period.

Environment Agency ↗Source retrieved 2026-10-03
Storm-overflow discharge duration — Fort Cumberland Road Eastney Sso
Storm-overflow discharge duration — Fort Cumberland Road Eastney Sso · retained published records
Area and periodFigureDefinition, source and limits
Portsmouth
2025
23.53 hours

Named outfall (SWS00325), discharging to LANGSTONE HARBOUR; not a city or harbour total. Spill count uses EA 12/24-hour method. Duration is monitored discharge time, not sewage volume or a real-time bathing safety result. Monitor operational for 99.81% of reporting period.

Environment Agency ↗Source retrieved 2026-10-03
Storm-overflow monitor operability — Fort Cumberland Road Eastney Sso
Storm-overflow monitor operability — Fort Cumberland Road Eastney Sso · retained published records
Area and periodFigureDefinition, source and limits
Portsmouth
2025
99.81%

Named outfall (SWS00325), discharging to LANGSTONE HARBOUR; not a city or harbour total. Spill count uses EA 12/24-hour method. Duration is monitored discharge time, not sewage volume or a real-time bathing safety result. Monitor operational for 99.81% of reporting period.

Environment Agency ↗Source retrieved 2026-10-03
Counted storm-overflow spills — Henderson Road Eastney Cso
Counted storm-overflow spills — Henderson Road Eastney Cso · retained published records
Area and periodFigureDefinition, source and limits
Portsmouth
2025
86

Named outfall (SWS00416), discharging to THE SOLENT; not a city or harbour total. Spill count uses EA 12/24-hour method. Duration is monitored discharge time, not sewage volume or a real-time bathing safety result. Monitor operational for 97.52% of reporting period.

Environment Agency ↗Source retrieved 2026-10-03
Storm-overflow discharge duration — Henderson Road Eastney Cso
Storm-overflow discharge duration — Henderson Road Eastney Cso · retained published records
Area and periodFigureDefinition, source and limits
Portsmouth
2025
499.56 hours

Named outfall (SWS00416), discharging to THE SOLENT; not a city or harbour total. Spill count uses EA 12/24-hour method. Duration is monitored discharge time, not sewage volume or a real-time bathing safety result. Monitor operational for 97.52% of reporting period.

Environment Agency ↗Source retrieved 2026-10-03
Storm-overflow monitor operability — Henderson Road Eastney Cso
Storm-overflow monitor operability — Henderson Road Eastney Cso · retained published records
Area and periodFigureDefinition, source and limits
Portsmouth
2025
97.52%

Named outfall (SWS00416), discharging to THE SOLENT; not a city or harbour total. Spill count uses EA 12/24-hour method. Duration is monitored discharge time, not sewage volume or a real-time bathing safety result. Monitor operational for 97.52% of reporting period.

Environment Agency ↗Source retrieved 2026-10-03
NO₂ annual mean — Southampton Centre
NO₂ annual mean — Southampton Centre · retained published records
Area and periodFigureDefinition, source and limits
Southampton
2025
21.29 µg/m³

Derived arithmetic mean of ratified UK-AIR hourly observations (98.69% annual capture); not a published citywide average. Southampton Centre is an urban background station. No adjustment for missing hours has been applied.

Defra UK-AIR ↗Source retrieved 2026-10-03
PM₁₀ annual mean — Southampton Centre
PM₁₀ annual mean — Southampton Centre · retained published records
Area and periodFigureDefinition, source and limits
Southampton
2025
14.91 µg/m³

Derived arithmetic mean of ratified UK-AIR hourly observations (99.90% annual capture); not a published citywide average. Southampton Centre is an urban background station. No adjustment for missing hours has been applied.

Defra UK-AIR ↗Source retrieved 2026-10-03
PM₂.₅ annual mean — Southampton Centre
PM₂.₅ annual mean — Southampton Centre · retained published records
Area and periodFigureDefinition, source and limits
Southampton
2025
9.03 µg/m³

Derived arithmetic mean of ratified UK-AIR hourly observations (99.90% annual capture); not a published citywide average. Southampton Centre is an urban background station. No adjustment for missing hours has been applied.

Defra UK-AIR ↗Source retrieved 2026-10-03
NO₂ annual mean — Southampton A33
NO₂ annual mean — Southampton A33 · retained published records
Area and periodFigureDefinition, source and limits
Southampton
2025
25.20 µg/m³

Derived arithmetic mean of ratified UK-AIR hourly observations (94.29% annual capture); not a published citywide average. Southampton A33 is an urban traffic station. No adjustment for missing hours has been applied.

Defra UK-AIR ↗Source retrieved 2026-10-03
PM₁₀ annual mean — Southampton A33
PM₁₀ annual mean — Southampton A33 · retained published records
Area and periodFigureDefinition, source and limits
Southampton
2025
15.60 µg/m³

Derived arithmetic mean of ratified UK-AIR hourly observations (99.90% annual capture); not a published citywide average. Southampton A33 is an urban traffic station. No adjustment for missing hours has been applied.

Defra UK-AIR ↗Source retrieved 2026-10-03
PM₂.₅ annual mean — Southampton A33
PM₂.₅ annual mean — Southampton A33 · retained published records
Area and periodFigureDefinition, source and limits
Southampton
2025
8.87 µg/m³

Derived arithmetic mean of ratified UK-AIR hourly observations (99.90% annual capture); not a published citywide average. Southampton A33 is an urban traffic station. No adjustment for missing hours has been applied.

Defra UK-AIR ↗Source retrieved 2026-10-03
Itchen — ecological status
Itchen — ecological status · retained published records
Area and periodFigureDefinition, source and limits
Southampton
2022, cycle 3
Good

Water Framework Directive classification for this named water body. Heavily modified waters are assessed for ecological potential. This is not a real-time bathing-water result, a citywide water-quality average, or a statement that every chemical pollutant meets its standard.

Environment Agency ↗Source retrieved 2026-10-03
Southampton Water — ecological potential
Southampton Water — ecological potential · retained published records
Area and periodFigureDefinition, source and limits
Southampton
2022, cycle 3
Moderate

Water Framework Directive classification for this named water body. Heavily modified waters are assessed for ecological potential. This is not a real-time bathing-water result, a citywide water-quality average, or a statement that every chemical pollutant meets its standard.

Environment Agency ↗Source retrieved 2026-10-03
Portsmouth Harbour — ecological potential
Portsmouth Harbour — ecological potential · retained published records
Area and periodFigureDefinition, source and limits
Portsmouth
2022, cycle 3
Moderate

Water Framework Directive classification for this named water body. Heavily modified waters are assessed for ecological potential. This is not a real-time bathing-water result, a citywide water-quality average, or a statement that every chemical pollutant meets its standard.

Environment Agency ↗Source retrieved 2026-10-03
Properties in high river/sea flood-risk areas
Properties in high river/sea flood-risk areas · retained published records
Area and periodFigureDefinition, source and limits
Southampton
June 2026
About 1,860

Modelled risk of flooding from rivers and sea, allowing for flood defences; excludes surface-water and groundwater flooding. Includes residential, non-residential and unclassified properties from the National Receptor Dataset 2023. June 2026 risk model, not a count of properties flooded. At least a 3.3% annual chance. Display rounded to the nearest 10; source value retained.

Environment Agency ↗Source retrieved 2026-10-03
Portsmouth
June 2026
About 2,850

Modelled risk of flooding from rivers and sea, allowing for flood defences; excludes surface-water and groundwater flooding. Includes residential, non-residential and unclassified properties from the National Receptor Dataset 2023. June 2026 risk model, not a count of properties flooded. At least a 3.3% annual chance. Display rounded to the nearest 10; source value retained.

Environment Agency ↗Source retrieved 2026-10-03
Properties in medium river/sea flood-risk areas
Properties in medium river/sea flood-risk areas · retained published records
Area and periodFigureDefinition, source and limits
Southampton
June 2026
About 970

Modelled risk of flooding from rivers and sea, allowing for flood defences; excludes surface-water and groundwater flooding. Includes residential, non-residential and unclassified properties from the National Receptor Dataset 2023. June 2026 risk model, not a count of properties flooded. At least 1% but less than 3.3% annual chance. Display rounded to the nearest 10; source value retained.

Environment Agency ↗Source retrieved 2026-10-03
Portsmouth
June 2026
About 990

Modelled risk of flooding from rivers and sea, allowing for flood defences; excludes surface-water and groundwater flooding. Includes residential, non-residential and unclassified properties from the National Receptor Dataset 2023. June 2026 risk model, not a count of properties flooded. At least 1% but less than 3.3% annual chance. Display rounded to the nearest 10; source value retained.

Environment Agency ↗Source retrieved 2026-10-03
Properties in low river/sea flood-risk areas
Properties in low river/sea flood-risk areas · retained published records
Area and periodFigureDefinition, source and limits
Southampton
June 2026
About 1,800

Modelled risk of flooding from rivers and sea, allowing for flood defences; excludes surface-water and groundwater flooding. Includes residential, non-residential and unclassified properties from the National Receptor Dataset 2023. June 2026 risk model, not a count of properties flooded. At least 0.1% but less than 1% annual chance. Display rounded to the nearest 10; source value retained.

Environment Agency ↗Source retrieved 2026-10-03
Portsmouth
June 2026
About 5,300

Modelled risk of flooding from rivers and sea, allowing for flood defences; excludes surface-water and groundwater flooding. Includes residential, non-residential and unclassified properties from the National Receptor Dataset 2023. June 2026 risk model, not a count of properties flooded. At least 0.1% but less than 1% annual chance. Display rounded to the nearest 10; source value retained.

Environment Agency ↗Source retrieved 2026-10-03
Properties in very low river/sea flood-risk areas
Properties in very low river/sea flood-risk areas · retained published records
Area and periodFigureDefinition, source and limits
Southampton
June 2026
About 520

Modelled risk of flooding from rivers and sea, allowing for flood defences; excludes surface-water and groundwater flooding. Includes residential, non-residential and unclassified properties from the National Receptor Dataset 2023. June 2026 risk model, not a count of properties flooded. Less than 0.1% annual chance. Display rounded to the nearest 10; source value retained.

Environment Agency ↗Source retrieved 2026-10-03
Portsmouth
June 2026
About 2,690

Modelled risk of flooding from rivers and sea, allowing for flood defences; excludes surface-water and groundwater flooding. Includes residential, non-residential and unclassified properties from the National Receptor Dataset 2023. June 2026 risk model, not a count of properties flooded. Less than 0.1% annual chance. Display rounded to the nearest 10; source value retained.

Environment Agency ↗Source retrieved 2026-10-03
Properties in all mapped risk bands river/sea flood-risk areas
Properties in all mapped risk bands river/sea flood-risk areas · retained published records
Area and periodFigureDefinition, source and limits
Southampton
June 2026
About 5,140

Modelled risk of flooding from rivers and sea, allowing for flood defences; excludes surface-water and groundwater flooding. Includes residential, non-residential and unclassified properties from the National Receptor Dataset 2023. June 2026 risk model, not a count of properties flooded. Includes the very-low likelihood band. Display rounded to the nearest 10; source value retained.

Environment Agency ↗Source retrieved 2026-10-03
Portsmouth
June 2026
About 11,830

Modelled risk of flooding from rivers and sea, allowing for flood defences; excludes surface-water and groundwater flooding. Includes residential, non-residential and unclassified properties from the National Receptor Dataset 2023. June 2026 risk model, not a count of properties flooded. Includes the very-low likelihood band. Display rounded to the nearest 10; source value retained.

Environment Agency ↗Source retrieved 2026-10-03
Share of properties in mapped river/sea flood-risk areas
Share of properties in mapped river/sea flood-risk areasJune 2026 · %
  • Southampton4.138%
  • Portsmouth10.767%
Share of properties in mapped river/sea flood-risk areas · retained published records
Area and periodFigureDefinition, source and limits
Southampton
June 2026
4.14%

Includes every mapped likelihood band, including very low. Denominator is all NRD 2023 properties in the local authority, including non-residential properties. Modelled risk with defences; not a prediction that this percentage will flood.

Environment Agency ↗Source retrieved 2026-10-03
Portsmouth
June 2026
10.77%

Includes every mapped likelihood band, including very low. Denominator is all NRD 2023 properties in the local authority, including non-residential properties. Modelled risk with defences; not a prediction that this percentage will flood.

Environment Agency ↗Source retrieved 2026-10-03

Source downloads and methods →