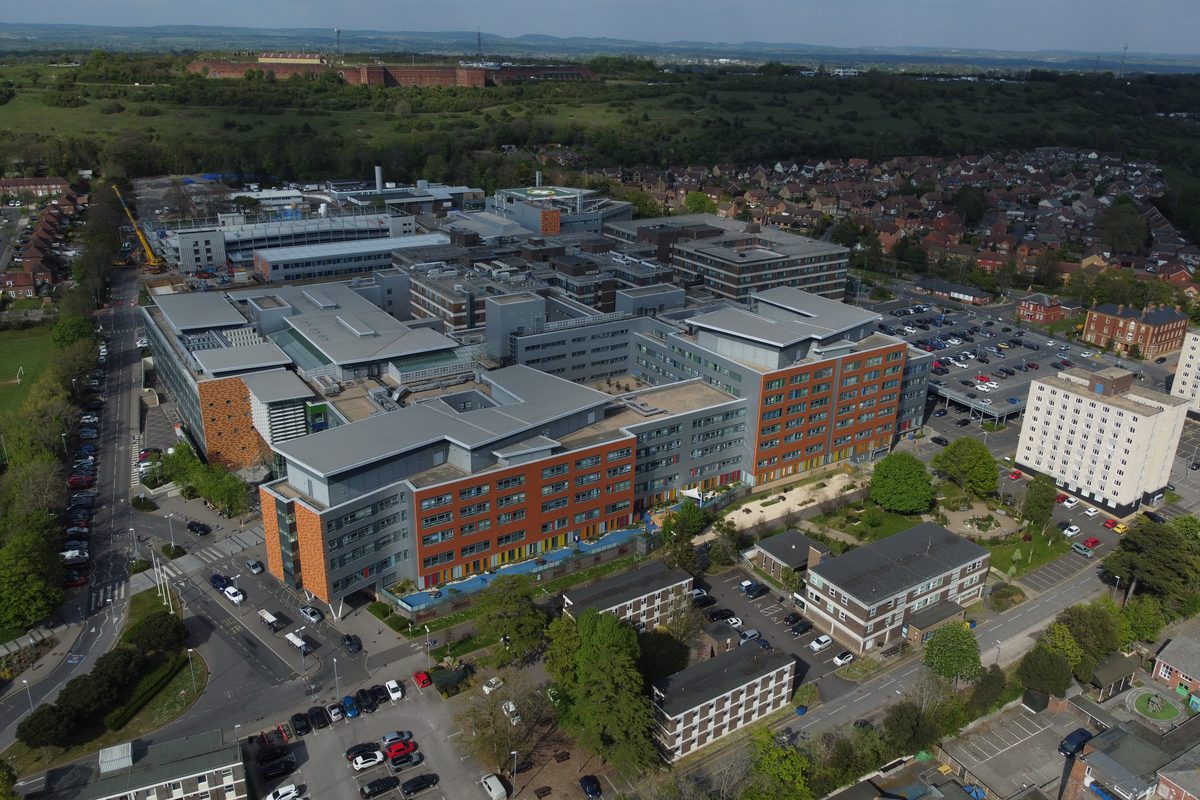
Portsmouth's long waits for a bed also appear in local NHS papers
NHS Hampshire and Isle of Wight's system report for July 2025, included in University Hospital Southampton's Trust Board papers for 9 September 2025, recorded 979 waits of over 12 hours from a decision to admit at Portsmouth Hospitals University NHS Trust, up from 838 the month before. The report gave 1,551 such waits across the whole area, the highest number on record. These are the same figures as in the trust's returns to NHS England, so they confirm what was reported, not why it rose.
NHS Hampshire and Isle of Wight Integrated Care Board (in University Hospital Southampton NHS Foundation Trust Trust Board papers) ↗
Corridor care at Queen Alexandra Hospital
The Care Quality Commission inspected urgent and emergency care at Queen Alexandra Hospital in May 2025, after the move to the new emergency department in November 2024. It again rated the service as requiring improvement, found that overcrowding led to corridor care in some areas, and found escalation areas were not always suitable, affecting people's dignity and safety. The trust overall remains rated good.
Care Quality Commission ↗
Targets are being rebuilt in steps
NHS England's planning framework for 2026/27 to 2028/29 asks every trust to reach at least 82% of A&E patients seen within 4 hours by March 2027 and sets an average category 2 ambulance response of 25 minutes for 2026/27, falling to 18 minutes by 2028/29. For planned care it asks each trust to improve its 18-week performance by at least 7 points or reach 65%, heading for the 92% standard by 2028/29. For cancer it expects 80% within 62 days by March 2027 and 80% told within 28 days. Falling short of the constitutional standards (95%, 92%, 85%) is therefore expected for some time.
NHS England ↗
Portsmouth's 4-hour figures are missing for four years
From May 2019 to May 2023 Portsmouth Hospitals was one of 14 trusts testing new A&E measures for the Clinical Review of Standards. During that time it did not report the 4-hour measure, so there is no Portsmouth figure for those months, and NHS England's England figure for the same months leaves those trusts out.
NHS England ↗
Recorded depression is not the same as how many people are depressed
The depression figure counts adults on GP registers. It rises when more people come forward or GPs record more diagnoses, as well as when illness increases. It is assigned to the city by GP practice location, not by where patients live.
Office for Health Improvement and Disparities (OHID) ↗
Self-harm admissions may be undercounted in recent years
From 2021/22 hospitals began reporting same-day emergency care to a different dataset. OHID notes this may reduce the number of self-harm admissions counted, with injuries among the most affected, so part of any recent fall may be a recording change.
Office for Health Improvement and Disparities (OHID) ↗
Long-run change: share seen within 4 hours (major emergency department)
Average of the monthly figures for the latest 12 months (October 2025 to September 2026), compared with the same months 10 years earlier (October 2015 to September 2016) and the same months 5 years earlier (October 2020 to September 2021). Changes are percentage-point differences. A comparison is shown only where all 12 months have a figure in both periods. Portsmouth Hospitals: 62.6%, against 72.2% 10 years earlier (−9.6 percentage points); no comparison 5 years earlier (the trust did not report this measure during the 2019 to 2023 field test). University Hospital Southampton: 65.2%, against 87.4% 10 years earlier (−22.2 percentage points) and 85.3% 5 years earlier (−20.1 percentage points). University Hospitals Sussex: 59.7%; no comparison 10 or 5 years earlier (the trust was formed in April 2021). Hampshire Hospitals: 49.4%, against 82.3% 10 years earlier (−32.8 percentage points) and 81.1% 5 years earlier (−31.7 percentage points). The South East region: 63.5%, against 79.2% 5 years earlier (−15.7 percentage points); no comparison 10 years earlier (there is no South East region total before April 2018). England: 60.9%, against 85.1% 10 years earlier (−24.2 percentage points) and 73.3% 5 years earlier (−12.4 percentage points). Worked out from the series shown for this measure.
NHS England ↗
Long-run change: share seen within 4 hours (all A&E types)
Average of the monthly figures for the latest 12 months (October 2025 to September 2026), compared with the same months 10 years earlier (October 2015 to September 2016) and the same months 5 years earlier (October 2020 to September 2021). Changes are percentage-point differences. A comparison is shown only where all 12 months have a figure in both periods. Portsmouth Hospitals: 73.0%, against 78.2% 10 years earlier (−5.2 percentage points); no comparison 5 years earlier (the trust did not report this measure during the 2019 to 2023 field test). University Hospital Southampton: 68.1%, against 89.4% 10 years earlier (−21.3 percentage points) and 86.2% 5 years earlier (−18.1 percentage points). University Hospitals Sussex: 63.4%; no comparison 10 or 5 years earlier (the trust was formed in April 2021). Hampshire Hospitals: 63.0%, against 84.0% 10 years earlier (−21.0 percentage points) and 81.6% 5 years earlier (−18.6 percentage points). The South East region: 76.7%, against 85.3% 5 years earlier (−8.6 percentage points); no comparison 10 years earlier (there is no South East region total before April 2018). England: 74.9%, against 90.1% 10 years earlier (−15.2 percentage points) and 81.4% 5 years earlier (−6.6 percentage points). Worked out from the series shown for this measure.
NHS England ↗
Long-run change: share of patients who spent more than 12 hours in the emergency department
Average of the monthly figures for the latest 12 months (September 2025 to August 2026), compared with the first 12 months published (February 2023 to January 2024). Changes are percentage-point differences. A comparison is shown only where all 12 months have a figure in both periods. Portsmouth Hospitals: 14.1%, against 12.6% in the first 12 months published (+1.5 percentage points). University Hospital Southampton: 4.0%, against 2.4% in the first 12 months published (+1.6 percentage points). University Hospitals Sussex: 11.6%, against 11.4% in the first 12 months published (+0.2 percentage points). Hampshire Hospitals: 5.7%, against 4.8% in the first 12 months published (+0.9 percentage points). The South East region: 9.6%; no figure for the first 12 months (1 of the 12 months has no figure). England: 10.2%, against 9.6% in the first 12 months published (+0.6 percentage points). Worked out from the series shown for this measure.
NHS England ↗
Long-run change: patients waiting over 12 hours for a bed after the decision to admit
Average of the monthly figures for the latest 12 months (October 2025 to September 2026), compared with the same months 10 years earlier (October 2015 to September 2016) and the same months 5 years earlier (October 2020 to September 2021). Changes are relative (per cent) changes. A comparison is shown only where all 12 months have a figure in both periods. Portsmouth Hospitals: 1,134, against 6 10 years earlier (too few then for a meaningful percentage change) and 0 5 years earlier (too few then for a meaningful percentage change). University Hospital Southampton: 12, against 0 10 years earlier (too few then for a meaningful percentage change) and 0 5 years earlier (too few then for a meaningful percentage change). University Hospitals Sussex: 938; no comparison 10 or 5 years earlier (the trust was formed in April 2021). Hampshire Hospitals: 18, against 11 10 years earlier (too few then for a meaningful percentage change) and 0 5 years earlier (too few then for a meaningful percentage change). The South East region: 6,880, against 73 5 years earlier (about 94 times as many); no comparison 10 years earlier (there is no South East region total before April 2018). England: 51,583, against 121 10 years earlier (about 426 times as many) and 2,102 5 years earlier (about 25 times as many). Worked out from the series shown for this measure.
NHS England ↗
Long-run change: waits over 12 hours for a bed, per 1,000 emergency admissions through A&E
Average of the monthly figures for the latest 12 months (October 2025 to September 2026), compared with the same months 10 years earlier (October 2015 to September 2016) and the same months 5 years earlier (October 2020 to September 2021). Changes are differences per 1,000. A comparison is shown only where all 12 months have a figure in both periods. Portsmouth Hospitals: 357.5 per 1,000, against 2.1 per 1,000 10 years earlier (+355.4 per 1,000) and 0.0 per 1,000 5 years earlier (+357.5 per 1,000). University Hospital Southampton: 3.2 per 1,000, against 0.0 per 1,000 10 years earlier (+3.1 per 1,000) and 0.1 per 1,000 5 years earlier (+3.1 per 1,000). University Hospitals Sussex: 110.5 per 1,000; no comparison 10 or 5 years earlier (the trust was formed in April 2021). Hampshire Hospitals: 5.1 per 1,000, against 5.6 per 1,000 10 years earlier (−0.5 per 1,000) and 0.1 per 1,000 5 years earlier (+5.0 per 1,000). The South East region: 111.8 per 1,000, against 1.3 per 1,000 5 years earlier (+110.5 per 1,000); no comparison 10 years earlier (there is no South East region total before April 2018). England: 129.6 per 1,000, against 0.4 per 1,000 10 years earlier (+129.2 per 1,000) and 5.7 per 1,000 5 years earlier (+123.9 per 1,000). Worked out from the series shown for this measure.
NHS England ↗
Long-run change: share waiting under 18 weeks
Average of the monthly figures for the latest 12 months (September 2025 to August 2026), compared with the same months 10 years earlier (September 2015 to August 2016) and the same months 5 years earlier (September 2020 to August 2021). Changes are percentage-point differences. A comparison is shown only where all 12 months have a figure in both periods. Portsmouth Hospitals: 59.2%, against 91.8% 10 years earlier (−32.6 percentage points) and 65.3% 5 years earlier (−6.1 percentage points). University Hospital Southampton: 62.7%, against 92.3% 10 years earlier (−29.7 percentage points) and 67.2% 5 years earlier (−4.5 percentage points). University Hospitals Sussex: 52.6%; no comparison 10 or 5 years earlier (the trust was formed in April 2021). Hampshire Hospitals: 61.7%, against 92.2% 10 years earlier (−30.6 percentage points) and 65.7% 5 years earlier (−4.0 percentage points). The South East region: 62.5%, against 67.8% 5 years earlier (−5.3 percentage points); no comparison 10 years earlier (there is no South East region total before April 2018). England: 63.6%, against 91.4% 10 years earlier (−27.8 percentage points) and 66.2% 5 years earlier (−2.6 percentage points). Worked out from the series shown for this measure.
NHS England ↗
Long-run change: waiting list size
Average of the monthly figures for the latest 12 months (September 2025 to August 2026), compared with the same months 10 years earlier (September 2015 to August 2016) and the same months 5 years earlier (September 2020 to August 2021). Changes are relative (per cent) changes. A comparison is shown only where all 12 months have a figure in both periods. Portsmouth Hospitals: 57,471, against 28,419 10 years earlier (+102%) and 37,490 5 years earlier (+53%). University Hospital Southampton: 62,998, against 26,977 10 years earlier (+134%) and 37,834 5 years earlier (+67%). University Hospitals Sussex: 115,661; no comparison 10 or 5 years earlier (the trust was formed in April 2021). Hampshire Hospitals: 49,973, against 34,135 10 years earlier (+46%) and 41,690 5 years earlier (+20%). The South East region: 1,047,953, against 701,396 5 years earlier (+49%); no comparison 10 years earlier (there is no South East region total before April 2018). England: 7,285,014, against 3,677,502 10 years earlier (+98%) and 4,971,148 5 years earlier (+47%). Worked out from the series shown for this measure.
NHS England ↗
Long-run change: waiting more than a year
Average of the monthly figures for the latest 12 months (September 2025 to August 2026), compared with the same months 10 years earlier (September 2015 to August 2016) and the same months 5 years earlier (September 2020 to August 2021). Changes are relative (per cent) changes. A comparison is shown only where all 12 months have a figure in both periods. Portsmouth Hospitals: 2,180, against 1 10 years earlier (too few then for a meaningful percentage change) and 1,577 5 years earlier (+38%). University Hospital Southampton: 1,543, against 0 10 years earlier (too few then for a meaningful percentage change) and 2,461 5 years earlier (−37%). University Hospitals Sussex: 4,719; no comparison 10 or 5 years earlier (the trust was formed in April 2021). Hampshire Hospitals: 1,494, against 0 10 years earlier (too few then for a meaningful percentage change) and 2,224 5 years earlier (−33%). The South East region: 21,236, against 33,219 5 years earlier (−36%); no comparison 10 years earlier (there is no South East region total before April 2018). England: 128,129, against 1,025 10 years earlier (about 125 times as many) and 288,907 5 years earlier (−56%). Worked out from the series shown for this measure.
NHS England ↗
Long-run change: share of the waiting list waiting more than a year
Average of the monthly figures for the latest 12 months (September 2025 to August 2026), compared with the same months 10 years earlier (September 2015 to August 2016) and the same months 5 years earlier (September 2020 to August 2021). Changes are percentage-point differences. A comparison is shown only where all 12 months have a figure in both periods. Portsmouth Hospitals: 3.79%, against 0.00% 10 years earlier (+3.78 percentage points) and 4.22% 5 years earlier (−0.43 percentage points). University Hospital Southampton: 2.44%, against 0.00% 10 years earlier (+2.44 percentage points) and 6.53% 5 years earlier (−4.08 percentage points). University Hospitals Sussex: 4.08%; no comparison 10 or 5 years earlier (the trust was formed in April 2021). Hampshire Hospitals: 2.98%, against 0.00% 10 years earlier (+2.98 percentage points) and 5.34% 5 years earlier (−2.35 percentage points). The South East region: 2.02%, against 4.74% 5 years earlier (−2.71 percentage points); no comparison 10 years earlier (there is no South East region total before April 2018). England: 1.76%, against 0.03% 10 years earlier (+1.73 percentage points) and 5.78% 5 years earlier (−4.02 percentage points). Worked out from the series shown for this measure.
NHS England ↗
Long-run change: treatment started within 62 days
Average of the monthly figures for the latest 12 months (September 2025 to August 2026), compared with the first 12 months published (April 2022 to March 2023). Changes are percentage-point differences. A comparison is shown only where all 12 months have a figure in both periods. Portsmouth Hospitals: 71.4%, against 67.5% in the first 12 months published (+4.0 percentage points). University Hospital Southampton: 75.4%, against 68.7% in the first 12 months published (+6.7 percentage points). University Hospitals Sussex: 65.1%, against 58.0% in the first 12 months published (+7.1 percentage points). Hampshire Hospitals: 69.7%, against 73.4% in the first 12 months published (−3.7 percentage points). The South East region: 72.8%, against 69.0% in the first 12 months published (+3.8 percentage points). England: 70.2%, against 64.9% in the first 12 months published (+5.4 percentage points). Worked out from the series shown for this measure.
NHS England ↗
Long-run change: told the outcome within 28 days
Average of the monthly figures for the latest 12 months (September 2025 to August 2026), compared with the first 12 months published (April 2022 to March 2023). Changes are percentage-point differences. A comparison is shown only where all 12 months have a figure in both periods. Portsmouth Hospitals: 70.7%, against 77.7% in the first 12 months published (−6.9 percentage points). University Hospital Southampton: 77.5%, against 78.9% in the first 12 months published (−1.4 percentage points). University Hospitals Sussex: 75.9%, against 67.4% in the first 12 months published (+8.5 percentage points). Hampshire Hospitals: 73.8%, against 79.5% in the first 12 months published (−5.8 percentage points). The South East region: 78.2%, against 73.0% in the first 12 months published (+5.1 percentage points). England: 77.3%, against 70.2% in the first 12 months published (+7.1 percentage points). Worked out from the series shown for this measure.
NHS England ↗
Long-run change: share waiting 6 weeks or more
Average of the monthly figures for the latest 12 months (September 2025 to August 2026), compared with the same months 10 years earlier (September 2015 to August 2016) and the same months 5 years earlier (September 2020 to August 2021). Changes are percentage-point differences. A comparison is shown only where all 12 months have a figure in both periods. Portsmouth Hospitals: 47.6%, against 1.1% 10 years earlier (+46.5 percentage points) and 11.0% 5 years earlier (+36.6 percentage points). University Hospital Southampton: 19.2%, against 0.8% 10 years earlier (+18.4 percentage points) and 27.4% 5 years earlier (−8.2 percentage points). University Hospitals Sussex: 13.7%; no comparison 10 or 5 years earlier (the trust was formed in April 2021). Hampshire Hospitals: 30.2%, against 1.7% 10 years earlier (+28.6 percentage points) and 20.5% 5 years earlier (+9.7 percentage points). The South East region: 20.9%, against 19.2% 5 years earlier (+1.8 percentage points); no comparison 10 years earlier (there is no South East region total before April 2018). England: 23.0%, against 1.7% 10 years earlier (+21.3 percentage points) and 27.0% 5 years earlier (−4.0 percentage points). Worked out from the series shown for this measure.
NHS England ↗