Skip to content
Facts CountEdition: PortsmouthChange place
or browse all wards

Find your area

Portsmouth · Getting around

Getting around in Portsmouth

The short answer

People killed or seriously injured on the roads, per 100,000 residents in Portsmouth: 41.8 per 100,000 residents (2025), 3.3 per 100,000 residents lower than England (45.1); down 6.3 per 100,000 residents since 2016 (48.1).

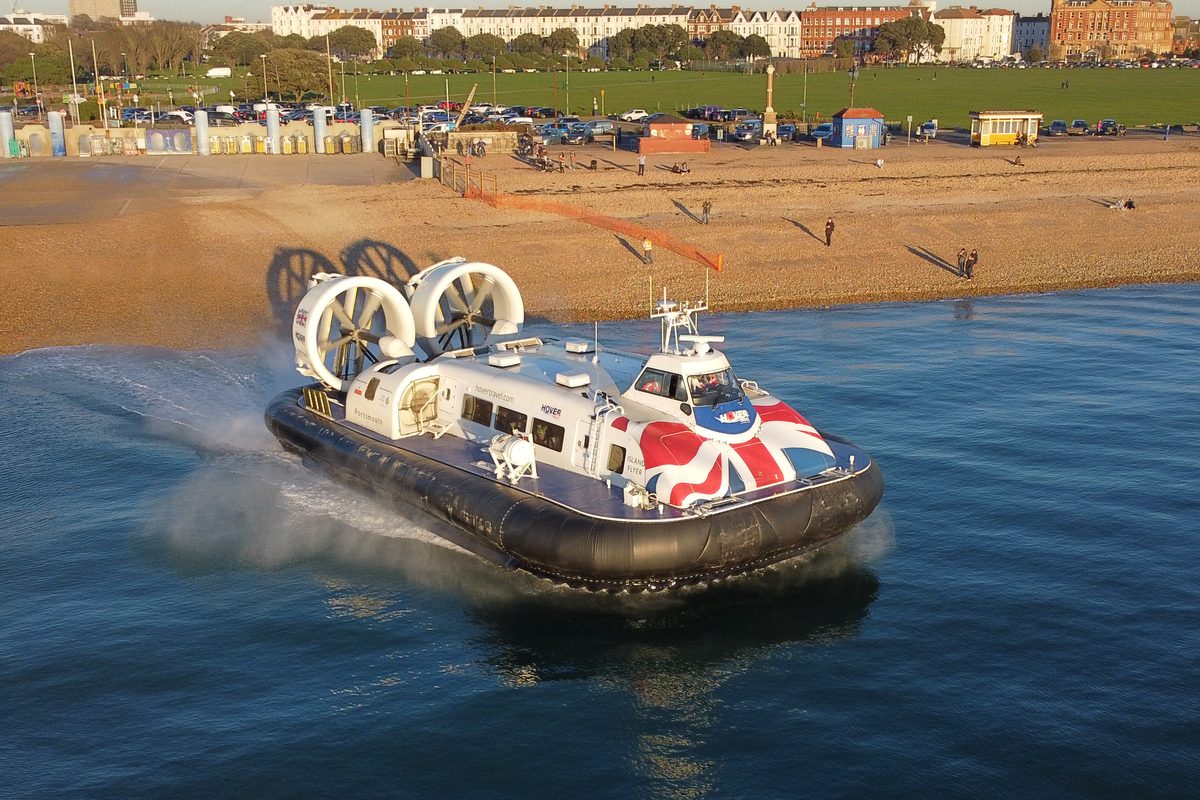
The Hovertravel hovercraft Island Flyer, with a Union Jack livery, pulling away from Southsea beach towards Ryde, with Southsea Common behind
Island Flyer hovercraft leaving Southsea. Photo: Tim Sheerman-Chase, CC BY 2.0, via Wikimedia Commons

People killed or seriously injured on the roads, per 100,000 residents: how Portsmouth compares

Allowing for population size, how does the number killed or seriously injured compare?

Area covered: Collisions inside the area divided by the people who live there; visitors and through traffic are in the numerator only.

Official statistics

People killed or seriously injured on the roads, per 100,000 residents

2016 to 2025

Portsmouth · per 100,000 residents

Reviewed figures: 2016 to 2025.

Shown on this chart: From 2016 to 2025, people killed or seriously injured on the roads, per 100,000 residents fell by 13.1% in Portsmouth and fell by 6.4% in England.

Both places compared over 2016 to 2025, using matching published dates.

Compared areas: Portsmouth; England.

Actual values

PortsmouthEngland

Each line joins consecutive published observations for that place. Missing dates remain gaps.

See the full comparison data
People killed or seriously injured on the roads, per 100,000 residents · per 100,000 residents
PeriodPortsmouthSouthamptonSouth EastEngland
202541.8 per 100,000 residents47.4 per 100,000 residents46.8 per 100,000 residents45.1 per 100,000 residents
202439.9 per 100,000 residents41.6 per 100,000 residents45.9 per 100,000 residents43.5 per 100,000 residents
202344.4 per 100,000 residents33.5 per 100,000 residents45.1 per 100,000 residents44.1 per 100,000 residents
202256.8 per 100,000 residents37.1 per 100,000 residents47.1 per 100,000 residents44.9 per 100,000 residents
202148 per 100,000 residents36.9 per 100,000 residents43.3 per 100,000 residents41.3 per 100,000 residents
202038.6 per 100,000 residents30.5 per 100,000 residents41.9 per 100,000 residents36.4 per 100,000 residents
201949.4 per 100,000 residents54 per 100,000 residents47.7 per 100,000 residents45.7 per 100,000 residents
201849.7 per 100,000 residents41.6 per 100,000 residents49.6 per 100,000 residents47.5 per 100,000 residents
201748.1 per 100,000 residents40.8 per 100,000 residents46.7 per 100,000 residents46.9 per 100,000 residents
201648.1 per 100,000 residents44.4 per 100,000 residents51.3 per 100,000 residents48.2 per 100,000 residents

Definition: DfT's severity-adjusted KSI casualties divided by the ONS mid-year population estimate for the same area and the same year, times 100,000. Calculated by this script; DfT does not publish this rate for local authorities.

  • Only casualties reported to the police are counted. DfT says many non-fatal injuries are never reported to police.
  • Local figures are small and move a lot from year to year; a single year's rise or fall is not a trend.
  • Population figures: ONS mid-year estimates (Nomis dataset NM_2002_1), fetched in the same run.
  • A city with many visitors, commuters or through roads can have a high rate per resident without its residents being at more risk.
  • Not shown: Chichester is part of West Sussex; this measure is only published for the whole county; Winchester is part of Hampshire; this measure is only published for the whole county.

What the numbers do and don’t tell you

An island city with few ways in and out

Most of Portsmouth is on Portsea Island. The council's transport strategy says there are three roads onto the island and one railway line, and the city is dense and mostly flat, which makes walking and cycling practical. Congestion on the few road links affects everyone, so traffic figures for the city include a lot of through traffic.

Getting around by water

The same strategy records five local ferry and hovercraft routes from Portsmouth, to Gosport, the Isle of Wight and Hayling Island. These journeys are not counted in the bus or road figures on this page.

Local traffic figures are estimates

DfT publishes local authority traffic as official statistics but not accredited ones, and says traffic at this level is not as robust as the national figures because few minor roads are counted. Use the long-run direction, not small year-to-year changes.

1 more notes, including long-run changes

Why serious injuries are 'adjusted'

Since 2012 some police forces, and from 2016 a large number, have moved to injury-based recording systems, which class more injuries as serious. DfT estimates what the figures would be if every force used injury-based recording, so years from 2016 can be compared fairly. Without that adjustment, a jump in serious injuries can reflect a recording change rather than more danger on the roads.

More measures

Collisions located inside the council boundary (from police-recorded coordinates), wherever the casualty lives.

People killed or seriously injured on the roads

88.4 people (adjusted estimate) 2025

Down 12% since 2016 (101).

Official statistics

Trend, comparison and definition

What this answers: How many people are killed or seriously injured in road collisions in the city each year?

People killed or seriously injured on the roads

2016 to 2025

Portsmouth · people (adjusted estimate)

Reviewed figures: 2016 to 2025.

Shown on this chart: From 2016 to 2025, people killed or seriously injured on the roads fell by 12.5% in Portsmouth and fell by 0.5% in England.

Both places compared over 2016 to 2025, using matching published dates.

Compared areas: Portsmouth; England.

Actual values

PortsmouthEngland

Each line joins consecutive published observations for that place. Missing dates remain gaps.

People killed or seriously injured on the roads · people (adjusted estimate)
PeriodPortsmouthSouthamptonSouth EastEngland
202588.4 people (adjusted estimate)123 people (adjusted estimate)4,537 people (adjusted estimate)26,517 people (adjusted estimate)
202485 people (adjusted estimate)108 people (adjusted estimate)4,420 people (adjusted estimate)25,488 people (adjusted estimate)
202395 people (adjusted estimate)86.5 people (adjusted estimate)4,298 people (adjusted estimate)25,555 people (adjusted estimate)
2022119 people (adjusted estimate)93.8 people (adjusted estimate)4,430 people (adjusted estimate)25,689 people (adjusted estimate)
202199.4 people (adjusted estimate)91.5 people (adjusted estimate)4,023 people (adjusted estimate)23,365 people (adjusted estimate)
202080.7 people (adjusted estimate)75.7 people (adjusted estimate)3,862 people (adjusted estimate)20,530 people (adjusted estimate)
2019104 people (adjusted estimate)135 people (adjusted estimate)4,390 people (adjusted estimate)25,689 people (adjusted estimate)
2018105 people (adjusted estimate)104 people (adjusted estimate)4,538 people (adjusted estimate)26,577 people (adjusted estimate)
2017102 people (adjusted estimate)102 people (adjusted estimate)4,255 people (adjusted estimate)26,088 people (adjusted estimate)
2016101 people (adjusted estimate)111 people (adjusted estimate)4,644 people (adjusted estimate)26,650 people (adjusted estimate)

Definition: Casualties killed or seriously injured (KSI) in reported road collisions that happened inside the area, using DfT's severity-adjusted estimates. Adjusted figures are estimates, so they are not whole numbers.

  • Only casualties reported to the police are counted. DfT says many non-fatal injuries are never reported to police.
  • Local figures are small and move a lot from year to year; a single year's rise or fall is not a trend.
  • England and South East figures come from DfT table RAS0402 and city figures from RAS0403 in the same release (RAS0402 file sha256 43910058502c9fbafccba0705ba9ef0dbef71fe51289b6601d4e96bec4311246).
  • DfT flags 2022 and 2023 data from Avon and Somerset and Staffordshire police as possibly incomplete; this affects England totals slightly, not Portsmouth or Southampton.
  • Not shown: Chichester is part of West Sussex; this measure is only published for the whole county; Winchester is part of Hampshire; this measure is only published for the whole county.

Series breaks: 2016: From 2016 many police forces moved to injury-based reporting (CRASH), which records more injuries as serious. DfT's adjusted figures put every year from 2016 on the same basis; they are not comparable with earlier unadjusted figures, so no pre-2016 years are joined to this series.

Portsmouth

People killed or seriously injured per billion miles driven

118 per billion motor vehicle miles 2025

Down 15 per billion motor vehicle miles since 2016 (133).

  • 510 all people injured on the roads

Official statistics

The numbers over time (1)

All people injured on the roads

All people injured on the roads

2016 to 2025

Portsmouth · people

Reviewed figures: 2016 to 2025.

Shown on this chart: From 2016 to 2025, all people injured on the roads fell by 21.8% in Portsmouth and fell by 27.7% in England.

Both places compared over 2016 to 2025, using matching published dates.

Compared areas: Portsmouth; England.

Actual values

PortsmouthEngland

Each line joins consecutive published observations for that place. Missing dates remain gaps.

All people injured on the roads · people
PeriodPortsmouthSouthamptonSouth EastEngland
2025510 people565 people19,869 people118,270 people
2024520 people568 people19,674 people118,546 people
2023534 people495 people21,208 people122,832 people
2022529 people555 people22,110 people125,424 people
2021486 people503 people19,847 people118,740 people
2020495 people431 people18,615 people106,886 people
2019563 people588 people24,075 people139,779 people
2018608 people621 people25,444 people146,445 people
2017614 people623 people27,058 people155,368 people
2016652 people650 people29,487 people163,646 people

All casualties (killed, seriously and slightly injured) in police-reported road collisions inside the area.

Trend, comparison and definition

What this answers: Allowing for how much traffic there is, how does the number killed or seriously injured compare between the cities?

People killed or seriously injured per billion miles driven

2016 to 2025

Portsmouth · per billion motor vehicle miles

Reviewed figures: 2016 to 2025.

Shown on this chart: From 2016 to 2025, people killed or seriously injured per billion miles driven fell by 11.1% in Portsmouth and rose by 11.7% in Southampton.

Both places compared over 2016 to 2025, using matching published dates.

Compared areas: Portsmouth; Nearest city (28 km in a straight line) and most similar city (ONS area classification: Major Urban University Centres). Figures cover the Southampton City Council area (E06000045), not the built-up city alone..

Actual values

PortsmouthSouthampton

Each line joins consecutive published observations for that place. Missing dates remain gaps.

People killed or seriously injured per billion miles driven · per billion motor vehicle miles
PeriodPortsmouthSouthampton
2025118 per billion motor vehicle miles197 per billion motor vehicle miles
2024115 per billion motor vehicle miles176 per billion motor vehicle miles
2023126 per billion motor vehicle miles143 per billion motor vehicle miles
2022157 per billion motor vehicle miles158 per billion motor vehicle miles
2021148 per billion motor vehicle miles168 per billion motor vehicle miles
2020137 per billion motor vehicle miles151 per billion motor vehicle miles
2019137 per billion motor vehicle miles212 per billion motor vehicle miles
2018140 per billion motor vehicle miles161 per billion motor vehicle miles
2017133 per billion motor vehicle miles161 per billion motor vehicle miles
2016133 per billion motor vehicle miles176 per billion motor vehicle miles

Definition: DfT's published rate: severity-adjusted KSI casualties per billion vehicle miles driven by motor vehicles in the area (pedal cycles excluded from the traffic).

  • England and the South East are not shown: DfT's regional table (RAS0402) uses traffic including pedal cycles, a different denominator, so it would not be like for like.
  • Local traffic estimates are less robust than national ones, so this rate carries extra uncertainty.
  • Only casualties reported to the police are counted. DfT says many non-fatal injuries are never reported to police.
  • Local figures are small and move a lot from year to year; a single year's rise or fall is not a trend.
  • Not shown: Chichester is part of West Sussex; this measure is only published for the whole county; Winchester is part of Hampshire; this measure is only published for the whole county.

Series breaks: 2016: From 2016 many police forces moved to injury-based reporting (CRASH), which records more injuries as serious. DfT's adjusted figures put every year from 2016 on the same basis; they are not comparable with earlier unadjusted figures, so no pre-2016 years are joined to this series.

All public roads inside the council boundary, including motorways and trunk roads (the M275 and A27 in Portsmouth).

Motor traffic on the city's roads

749 million vehicle miles 2025

Up 6% since 1993 (705).

Down 0.1% in the last ten years (from 750 in 2015).

Official statistics

Trend, comparison and definition

What this answers: How much motor traffic is driven on the city's roads each year, and is it rising or falling?

Motor traffic on the city's roads

1996 to 2025

Portsmouth · million vehicle miles

Reviewed figures: 1993 to 2025. The chart opens on the latest 30 years; choose All history for the full reviewed record.

Shown on this chart: From 1996 to 2025, motor traffic on the city's roads rose by 4.2% in Portsmouth and rose by 23.9% in England.

Both places compared over 1996 to 2025, using matching published dates.

Compared areas: Portsmouth; Sum of DfT's nine English region estimates (England is exactly the nine regions)..

Actual values

PortsmouthEngland

Each line joins consecutive published observations for that place. Missing dates remain gaps.

Motor traffic on the city's roads · million vehicle miles
PeriodPortsmouthSouthamptonSouth EastEngland
2025749 million vehicle miles623 million vehicle miles54,511 million vehicle miles292,566 million vehicle miles
2024742 million vehicle miles617 million vehicle miles53,601 million vehicle miles287,020 million vehicle miles
2023756 million vehicle miles603 million vehicle miles52,823 million vehicle miles282,460 million vehicle miles
2022757 million vehicle miles595 million vehicle miles51,620 million vehicle miles276,346 million vehicle miles
2021671 million vehicle miles543 million vehicle miles46,905 million vehicle miles254,369 million vehicle miles
2020590 million vehicle miles502 million vehicle miles42,419 million vehicle miles228,152 million vehicle miles
2019758 million vehicle miles637 million vehicle miles54,888 million vehicle miles289,473 million vehicle miles
2018749 million vehicle miles648 million vehicle miles54,488 million vehicle miles285,536 million vehicle miles
2017763 million vehicle miles634 million vehicle miles54,615 million vehicle miles284,188 million vehicle miles
2016761 million vehicle miles627 million vehicle miles54,284 million vehicle miles280,435 million vehicle miles
2015750 million vehicle miles628 million vehicle miles53,340 million vehicle miles274,542 million vehicle miles
2014734 million vehicle miles621 million vehicle miles51,907 million vehicle miles269,442 million vehicle miles
2013729 million vehicle miles607 million vehicle miles50,475 million vehicle miles261,998 million vehicle miles
2012734 million vehicle miles607 million vehicle miles50,494 million vehicle miles261,116 million vehicle miles
2011722 million vehicle miles606 million vehicle miles50,447 million vehicle miles261,134 million vehicle miles
2010717 million vehicle miles593 million vehicle miles50,081 million vehicle miles260,049 million vehicle miles
2009715 million vehicle miles599 million vehicle miles50,663 million vehicle miles263,631 million vehicle miles
2008714 million vehicle miles619 million vehicle miles51,440 million vehicle miles266,463 million vehicle miles
2007742 million vehicle miles653 million vehicle miles52,314 million vehicle miles269,013 million vehicle miles
2006753 million vehicle miles658 million vehicle miles52,086 million vehicle miles266,638 million vehicle miles
2005752 million vehicle miles669 million vehicle miles51,800 million vehicle miles263,292 million vehicle miles
2004769 million vehicle miles679 million vehicle miles52,139 million vehicle miles263,093 million vehicle miles
2003761 million vehicle miles682 million vehicle miles51,905 million vehicle miles259,868 million vehicle miles
2002761 million vehicle miles691 million vehicle miles52,049 million vehicle miles258,546 million vehicle miles
2001746 million vehicle miles676 million vehicle miles51,277 million vehicle miles253,181 million vehicle miles
2000743 million vehicle miles681 million vehicle miles50,678 million vehicle miles249,748 million vehicle miles
1999751 million vehicle miles684 million vehicle miles50,655 million vehicle miles250,113 million vehicle miles
1998742 million vehicle miles668 million vehicle miles49,643 million vehicle miles245,477 million vehicle miles
1997727 million vehicle miles661 million vehicle miles48,496 million vehicle miles240,967 million vehicle miles
1996719 million vehicle miles657 million vehicle miles47,328 million vehicle miles236,086 million vehicle miles
1995731 million vehicle miles649 million vehicle miles45,860 million vehicle miles230,011 million vehicle miles
1994717 million vehicle miles639 million vehicle miles44,885 million vehicle miles225,655 million vehicle miles
1993705 million vehicle miles631 million vehicle miles43,835 million vehicle miles220,777 million vehicle miles

Definition: Estimated miles driven by all motor vehicles (cars, taxis, vans, lorries, buses, motorcycles) on all public roads in the area in the year.

  • DfT says local authority traffic estimates are not as robust as national figures because of the small sample of minor-road counts, and must be treated with caution.
  • Traffic is counted where it is driven, not where drivers live: through traffic on the M275 and A27 counts towards Portsmouth.
  • Totals depend on the size of the area and its road network, so compare the direction of change rather than the size of the numbers.
  • Not shown: Chichester is part of West Sussex; this measure is only published for the whole county; Winchester is part of Hampshire; this measure is only published for the whole county.

All public roads inside the council boundary, including motorways and trunk roads (the M275 and A27 in Portsmouth).

Car and taxi traffic on the city's roads

602 million vehicle miles 2025

Up 0.8% since 1993 (597).

Down 0.9% in the last ten years (from 607 in 2015).

Official statistics

Trend, comparison and definition

What this answers: How much of the city's traffic is cars and taxis, and how has that changed?

Car and taxi traffic on the city's roads

1996 to 2025

Portsmouth · million vehicle miles

Reviewed figures: 1993 to 2025. The chart opens on the latest 30 years; choose All history for the full reviewed record.

Shown on this chart: From 1996 to 2025, car and taxi traffic on the city's roads fell by 0.8% in Portsmouth and rose by 16.6% in England.

Both places compared over 1996 to 2025, using matching published dates.

Compared areas: Portsmouth; Sum of DfT's nine English region estimates (England is exactly the nine regions)..

Actual values

PortsmouthEngland

Each line joins consecutive published observations for that place. Missing dates remain gaps.

Car and taxi traffic on the city's roads · million vehicle miles
PeriodPortsmouthSouthamptonSouth EastEngland
2025602 million vehicle miles503 million vehicle miles42,359 million vehicle miles224,718 million vehicle miles
2024593 million vehicle miles496 million vehicle miles41,333 million vehicle miles219,197 million vehicle miles
2023602 million vehicle miles483 million vehicle miles40,594 million vehicle miles215,057 million vehicle miles
2022597 million vehicle miles473 million vehicle miles39,320 million vehicle miles208,816 million vehicle miles
2021526 million vehicle miles426 million vehicle miles35,285 million vehicle miles189,674 million vehicle miles
2020461 million vehicle miles392 million vehicle miles31,855 million vehicle miles169,561 million vehicle miles
2019612 million vehicle miles517 million vehicle miles43,211 million vehicle miles225,160 million vehicle miles
2018603 million vehicle miles527 million vehicle miles42,885 million vehicle miles221,806 million vehicle miles
2017615 million vehicle miles516 million vehicle miles43,150 million vehicle miles220,941 million vehicle miles
2016613 million vehicle miles508 million vehicle miles42,887 million vehicle miles218,141 million vehicle miles
2015607 million vehicle miles508 million vehicle miles42,371 million vehicle miles214,705 million vehicle miles
2014596 million vehicle miles504 million vehicle miles41,423 million vehicle miles211,785 million vehicle miles
2013594 million vehicle miles495 million vehicle miles40,529 million vehicle miles207,035 million vehicle miles
2012600 million vehicle miles496 million vehicle miles40,646 million vehicle miles206,862 million vehicle miles
2011592 million vehicle miles495 million vehicle miles40,656 million vehicle miles207,054 million vehicle miles
2010587 million vehicle miles485 million vehicle miles40,288 million vehicle miles205,798 million vehicle miles
2009590 million vehicle miles493 million vehicle miles40,954 million vehicle miles209,526 million vehicle miles
2008585 million vehicle miles507 million vehicle miles41,366 million vehicle miles210,283 million vehicle miles
2007610 million vehicle miles535 million vehicle miles42,046 million vehicle miles211,767 million vehicle miles
2006622 million vehicle miles541 million vehicle miles42,109 million vehicle miles211,369 million vehicle miles
2005619 million vehicle miles551 million vehicle miles42,004 million vehicle miles209,300 million vehicle miles
2004634 million vehicle miles563 million vehicle miles42,447 million vehicle miles209,882 million vehicle miles
2003629 million vehicle miles568 million vehicle miles42,442 million vehicle miles208,205 million vehicle miles
2002638 million vehicle miles582 million vehicle miles42,868 million vehicle miles208,750 million vehicle miles
2001624 million vehicle miles569 million vehicle miles42,204 million vehicle miles204,248 million vehicle miles
2000623 million vehicle miles572 million vehicle miles41,755 million vehicle miles201,557 million vehicle miles
1999631 million vehicle miles576 million vehicle miles41,913 million vehicle miles202,352 million vehicle miles
1998623 million vehicle miles564 million vehicle miles41,040 million vehicle miles198,600 million vehicle miles
1997612 million vehicle miles559 million vehicle miles40,295 million vehicle miles195,868 million vehicle miles
1996606 million vehicle miles558 million vehicle miles39,511 million vehicle miles192,730 million vehicle miles
1995618 million vehicle miles552 million vehicle miles38,348 million vehicle miles188,015 million vehicle miles
1994606 million vehicle miles544 million vehicle miles37,567 million vehicle miles184,789 million vehicle miles
1993597 million vehicle miles538 million vehicle miles36,748 million vehicle miles181,129 million vehicle miles

Definition: Estimated miles driven by cars and taxis on all public roads in the area in the year.

  • DfT says local authority traffic estimates are not as robust as national figures because of the small sample of minor-road counts, and must be treated with caution.
  • Traffic is counted where it is driven, not where drivers live: through traffic on the M275 and A27 counts towards Portsmouth.
  • Totals depend on the size of the area and its road network, so compare the direction of change rather than the size of the numbers.
  • Not shown: Chichester is part of West Sussex; this measure is only published for the whole county; Winchester is part of Hampshire; this measure is only published for the whole county.

Journeys made on local bus services in the area, by anyone (including visitors).

Bus journeys per person

55.6 journeys per resident per year 2024/25

7 per resident per year lower than England (62.6).

Up 3 per resident per year since 2009/10 (52.6).

Up 4 per resident per year in the last ten years (from 51.6 in 2014/15).

  • 11.9 bus journeys made in the area

Official statistics

The numbers over time (1)

Bus journeys made in the area

Bus journeys made in the area

2009/10 to 2024/25

Portsmouth · million journeys

Reviewed figures: 2009/10 to 2024/25.

Shown on this chart: From 2009/10 to 2024/25, bus journeys made in the area rose by 13.8% in Portsmouth and fell by 20.4% in England.

Both places compared over 2009/10 to 2024/25, using matching published dates.

Compared areas: Portsmouth; England.

Actual values

PortsmouthEngland

Each line joins consecutive published observations for that place. Missing dates remain gaps.

Bus journeys made in the area · million journeys
PeriodPortsmouthSouthamptonSouth EastEngland
2024/2511.9 million journeys21.7 million journeys322 million journeys3,672 million journeys
2023/2411.5 million journeys20.5 million journeys307 million journeys3,629 million journeys
2022/239.4 million journeys18.1 million journeys274 million journeys3,389 million journeys
2021/227.8 million journeys14.6 million journeys221 million journeys2,840 million journeys
2020/213.9 million journeys7.4 million journeys113 million journeys1,582 million journeys
2019/209.9 million journeys20.3 million journeys334 million journeys4,075 million journeys
2018/1911 million journeys20.6 million journeys348 million journeys4,311 million journeys
2017/1811.6 million journeys20.6 million journeys350 million journeys4,348 million journeys
2016/1710.9 million journeys21.4 million journeys356 million journeys4,439 million journeys
2015/1611.2 million journeys20 million journeys353 million journeys4,511 million journeys
2014/1510.6 million journeys20.1 million journeys355 million journeys4,627 million journeys
2013/1410.3 million journeys18 million journeys355 million journeys4,672 million journeys
2012/1310.1 million journeys17.8 million journeys345 million journeys4,570 million journeys
2011/1210.9 million journeys18.2 million journeys345 million journeys4,640 million journeys
2010/1110.8 million journeys18 million journeys338 million journeys4,618 million journeys
2009/1010.5 million journeys18.6 million journeys332 million journeys4,613 million journeys

Passenger journeys on local bus services in the year to March, in millions. Each boarding counts as one journey.

Trend, comparison and definition

What this answers: How many local bus journeys are made each year for every person living in the area?

Bus journeys per person

2009/10 to 2024/25

Portsmouth · journeys per resident per year

Reviewed figures: 2009/10 to 2024/25.

Shown on this chart: From 2009/10 to 2024/25, bus journeys per person rose by 5.7% in Portsmouth and fell by 29.2% in England.

Both places compared over 2009/10 to 2024/25, using matching published dates.

Compared areas: Portsmouth; England.

Actual values

PortsmouthEngland

Each line joins consecutive published observations for that place. Missing dates remain gaps.

Bus journeys per person · journeys per resident per year
PeriodPortsmouthSouthamptonSouth EastEngland
2024/2555.6 journeys per resident per year83.6 journeys per resident per year33.4 journeys per resident per year62.6 journeys per resident per year
2023/2453.8 journeys per resident per year79.5 journeys per resident per year32.3 journeys per resident per year62.6 journeys per resident per year
2022/2345 journeys per resident per year71.8 journeys per resident per year29.2 journeys per resident per year59.3 journeys per resident per year
2021/2237.5 journeys per resident per year58.8 journeys per resident per year23.8 journeys per resident per year50.2 journeys per resident per year
2020/2118.8 journeys per resident per year29.8 journeys per resident per year12.3 journeys per resident per year28.1 journeys per resident per year
2019/2047 journeys per resident per year81.3 journeys per resident per year36.3 journeys per resident per year72.5 journeys per resident per year
2018/1952.1 journeys per resident per year82 journeys per resident per year38.1 journeys per resident per year77.1 journeys per resident per year
2017/1854.9 journeys per resident per year82.4 journeys per resident per year38.4 journeys per resident per year78.2 journeys per resident per year
2016/1751.9 journeys per resident per year86 journeys per resident per year39.3 journeys per resident per year80.3 journeys per resident per year
2015/1653.6 journeys per resident per year81.8 journeys per resident per year39.4 journeys per resident per year82.3 journeys per resident per year
2014/1551.6 journeys per resident per year83.3 journeys per resident per year39.9 journeys per resident per year85.1 journeys per resident per year
2013/1450.1 journeys per resident per year75.2 journeys per resident per year40.3 journeys per resident per year86.7 journeys per resident per year
2012/1349.3 journeys per resident per year74.7 journeys per resident per year39.6 journeys per resident per year85.4 journeys per resident per year
2011/1253 journeys per resident per year77.2 journeys per resident per year39.8 journeys per resident per year87.4 journeys per resident per year
2010/1153.3 journeys per resident per year77.2 journeys per resident per year39.4 journeys per resident per year87.7 journeys per resident per year
2009/1052.6 journeys per resident per year81 journeys per resident per year39.1 journeys per resident per year88.4 journeys per resident per year

Definition: Passenger journeys on local bus services in the year to March, divided by the area's resident population (DfT's published figure). Each boarding counts as one journey.

  • Journeys are counted where they happen, so visitors and commuters are included, but the population used for 'per head' is residents only (DfT note 3).
  • DfT marks figures for the years ending March 2022 to March 2025 as provisional.
  • The pandemic cut bus use sharply in the year to March 2021; that year is a real fall, not a data error.
  • DfT labels each year by the March it ends: '2009/10' here is DfT's 'year ending March 2010'.
  • Not shown: Chichester is part of West Sussex; this measure is only published for the whole county; Winchester is part of Hampshire; this measure is only published for the whole county.

People who live in the area, wherever they walk or cycle.

Adults who walk at least once a week

73.1% 2023

3.9 percentage points higher than England (69.2%).

Down 0.1 percentage points since 2016 (73.2%).

Survey-based evidence · Active Lives Survey (Sport England), published by DfT · Adults aged 16 and over living in the area · Mid-November to mid-November each year, November 2015 to November 2023

Trend, comparison and definition

What this answers: What share of adults living in the area walk (a continuous walk of over 10 minutes) at least once a week?

Adults who walk at least once a week

2016 to 2023

Portsmouth · %

Reviewed figures: 2016 to 2023.

Shown on this chart: From 2016 to 2023, adults who walk at least once a week fell by 0.1 percentage points in Portsmouth and rose by 1.2 percentage points in England.

Both places compared over 2016 to 2023, using matching published dates.

Compared areas: Portsmouth; England.

Actual values

PortsmouthEngland

Each line joins consecutive published observations for that place. Missing dates remain gaps.

Adults who walk at least once a week · % of adults
PeriodPortsmouthSouthamptonChichesterWinchesterSouth EastEngland
202373.1%69.8%74.1%79.1%72.2%69.2%
202269.8%71.9%73.1%75.7%72.4%69.1%
202170.9%66.5%79.4%75.4%73%69.7%
202070.1%66.1%71.7%77.6%70%67.3%
201972.4%74.1%76.1%79.5%73.3%71.1%
201877.5%71.9%75.6%76.6%72.3%69.5%
201770.7%71%73.7%78.6%71.5%69.4%
201673.2%71.9%73.2%71.1%69.9%68%

Definition: Share of adults who did any walking, for any purpose, at least once a week. Walking means a continuous walk of over 10 minutes. The year label is the year the 12-month survey period ends in mid-November.

  • This is a survey estimate. A few hundred Portsmouth residents answer each year, so the range shown (95% confidence interval) is several percentage points wide.
  • Differences between years or places smaller than the confidence ranges may be due to chance.
  • Results are grouped by where people live, not where they walk or cycle (DfT note 4).
  • The latest DfT local table covers the year to November 2023; later local figures were not found on the DfT page when this file was produced.

People who live in the area, wherever they walk or cycle.

Adults who cycle at least once a week

13.3% 2023

3.2 percentage points higher than England (10.1%).

Down 3.4 percentage points since 2016 (16.7%).

Survey-based evidence · Active Lives Survey (Sport England), published by DfT · Adults aged 16 and over living in the area · Mid-November to mid-November each year, November 2015 to November 2023

Trend, comparison and definition

What this answers: What share of adults living in the area cycle at least once a week, for any reason?

Adults who cycle at least once a week

2016 to 2023

Portsmouth · %

Reviewed figures: 2016 to 2023.

Shown on this chart: From 2016 to 2023, adults who cycle at least once a week fell by 3.4 percentage points in Portsmouth and fell by 1.8 percentage points in England.

Both places compared over 2016 to 2023, using matching published dates.

Compared areas: Portsmouth; England.

Actual values

PortsmouthEngland

Each line joins consecutive published observations for that place. Missing dates remain gaps.

Adults who cycle at least once a week · % of adults
PeriodPortsmouthSouthamptonChichesterWinchesterSouth EastEngland
202313.3%10%14.8%10.3%10.8%10.1%
202212.3%12.2%13.1%10.1%10.8%9.3%
202113.8%12.9%14.8%13.4%10.3%9.1%
202016.9%12.7%14.7%17.3%13.3%11.6%
201918.4%16.6%19%9.8%13.1%11.2%
201819.7%12.4%18.1%13.7%12.9%11.5%
201719.6%14.6%15.6%13.7%13.4%11.9%
201616.7%14.6%20.4%9.6%13.4%11.9%

Definition: Share of adults who did any cycling, for any purpose, at least once a week. Any cycling of any length counts. The year label is the year the 12-month survey period ends in mid-November.

  • This is a survey estimate. A few hundred Portsmouth residents answer each year, so the range shown (95% confidence interval) is several percentage points wide.
  • Differences between years or places smaller than the confidence ranges may be due to chance.
  • Results are grouped by where people live, not where they walk or cycle (DfT note 4).
  • The latest DfT local table covers the year to November 2023; later local figures were not found on the DfT page when this file was produced.

Council area on the boundaries used for each census.

Households with no car or van

30.3% 2021

6.8 percentage points higher than England (23.5%).

Down 3.1 percentage points since 2011 (33.4%).

Official statistics

Trend, comparison and definition

What this answers: What share of households have no car or van available, and how did that change between the last two censuses?

Households with no car or van

2011 to 2021

Portsmouth · %

Reviewed figures: 2011 to 2021.

Shown on this chart: From 2011 to 2021, households with no car or van fell by 3.1 percentage points in Portsmouth and fell by 2.3 percentage points in England.

Both places compared over 2011 to 2021, using matching published dates.

Compared areas: Portsmouth; England.

Actual values

PortsmouthEngland

Each line joins consecutive published observations for that place. Missing dates remain gaps.

Households with no car or van · % of households
PeriodPortsmouthSouthamptonChichesterWinchesterSouth EastEngland
202130.3%27.4%14.1%13.5%16.9%23.5%
201133.4%29.5%15.6%14.3%18.6%25.8%

Definition: Share of households where no member has a car or van available, from the census (2011: table QS416EW; 2021: table TS045). Two dated snapshots, ten years apart; nothing is known about the years between.

  • Census 2021 took place on 21 March 2021, during the pandemic; ONS says car availability is comparable with 2011.
  • Ward figures use the 2022 ward boundaries ONS published for Census 2021 and cannot be compared with 2011 wards.
  • Census 2011 file sha256 f4716024eddfc529d6a2be71e86fddca8467091b76dc2bc91e200e7c8d973ace; ward file sha256 dbec463fe60ff4fbfd59cc55c5c08678f198625bf3522529f3dcdc91c532aeda.

Households with no car or van: ward by ward

Households with no car or van · % of households · 2021
WardValue
Charles Dickens57.2%
St Thomas (Portsmouth)41.9%
St Jude35.8%
Nelson (Portsmouth)35.6%
Fratton35%
Central Southsea32.4%
Cosham27.2%
Eastney and Craneswater25.9%
Milton (Portsmouth)25.4%
Paulsgrove23.5%
Hilsea22.4%
Baffins19.3%
Copnor17.4%
Drayton and Farlington12.1%

Who can act

  • Portsmouth City Council — Local transport authority and highway authority for the city's roads: road maintenance, street lights, local transport plan, bus partnership and Clean Air Zone.
  • National Highways — Runs the strategic road network in England, including the M275 and the A27 along the north of the city.
  • Bus operators (First Bus and Stagecoach South) — Run most local bus routes on a commercial basis; the council can fund extra routes and sets up the bus partnership.
  • Department for Transport — Sets national road safety, bus and active travel policy and funding, and publishes the statistics on this page.

See what could change in Portsmouth → · Your councillors and MPs →

Support & Services

What we couldn’t find yet (5)

These figures would help residents but are not published for Portsmouth in a form we can check and refresh automatically.

  • Road casualties before 2016 on a comparable basis. DfT's local authority table covers only the latest 10 years. Earlier years exist in DfT's record-level STATS19 open data, but serious-injury counts before 2016 are not on the same basis without DfT's per-casualty adjustment. Department for Transport, Road Safety Open Data (https://www.gov.uk/government/statistical-data-sets/road-safety-open-data): collision and casualty files from 1979 with adjusted-severity fields, which are large files needing record-level processing.
  • Road casualties by where the casualty lives, and by ward. The published tables place casualties by collision location only, and no ward breakdown is published. STATS19 open data gives collision coordinates and a casualty home-area deprivation decile; ward counts would need geocoding against ONS ward boundaries.
  • Walking and cycling for Portsmouth after November 2023. The DfT CW tables found for this run end at the year to November 2023. Sport England publishes Active Lives Adult data (https://www.sportengland.org/research-and-data/data/active-lives); check for a newer DfT walking and cycling release.
  • Ferry and hovercraft passengers. Not published by local authority in the DfT statistics used here. DfT sea passenger statistics (route-level, SPAS tables) and operators Wightlink, Hovertravel and Gosport Ferry.
  • Bus punctuality and reliability for Portsmouth. Not published for Portsmouth as an area in the statistics used here. It could be requested under the Freedom of Information Act: Ask Portsmouth City Council for its Bus Service Improvement Plan monitoring data (punctuality, reliability), or the operators.
Sources and method

Comparison places are chosen automatically: the three nearest official cities, and the three most similar cities in the ONS area classification (cities whose council areas have a similar population make-up), plus England. Where a measure is only published for whole counties, cities inside a county are left out rather than replaced by the county.

Figures are fetched by a script from the official source and shown unchanged. Comparisons use the same definition and period for every place. Rates and shares change in percentage points; counts and levels change in per cent. An increase is not automatically good or bad.

All the data in this topic

The retained source collection contains 0 records for this topic, including comparison areas and older releases. Each record keeps its own period and source date. Current findings above may use newer releases; a later page update does not refresh every record.

Browse 0 measures and their sources

Source downloads and methods →