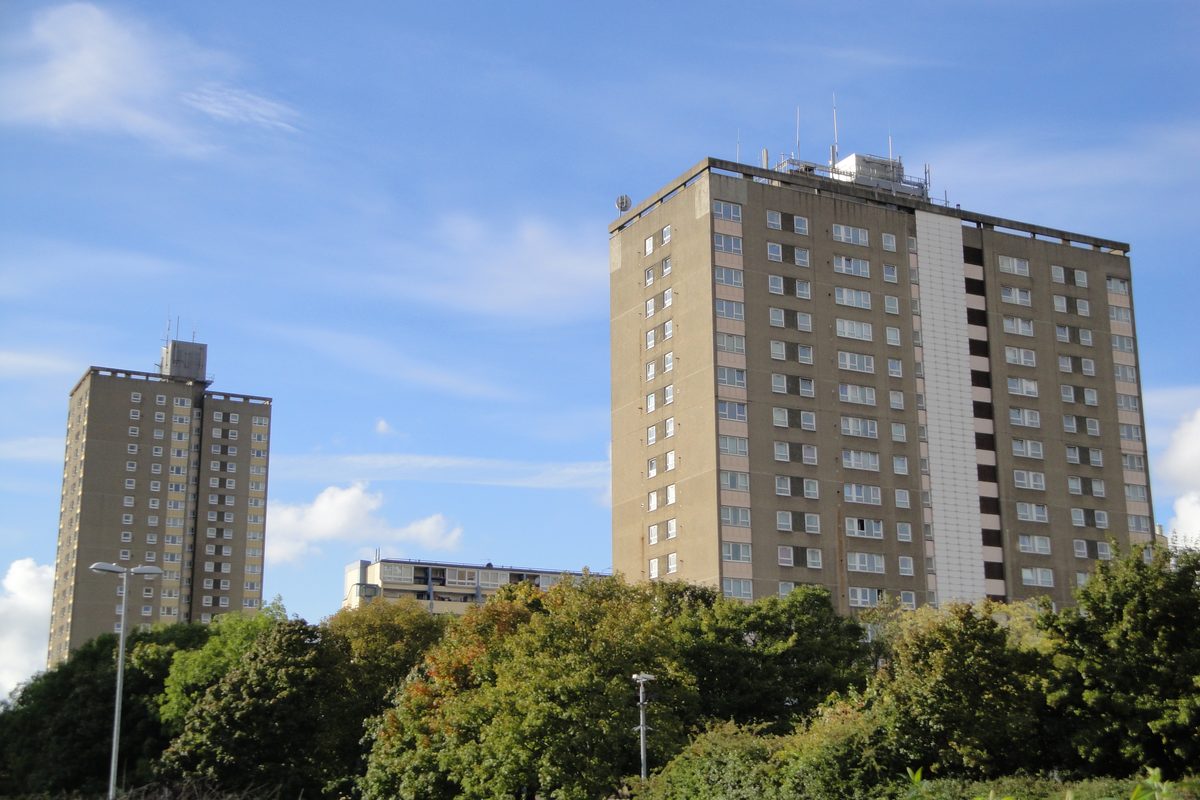
Portsmouth
2002 | 4.90 | Median price paid for properties divided by median gross annual full-time employee earnings of residents. This is not a household mortgage multiple, workplace earnings ratio or ratio computed from the monthly house-price index. ONS ↗Source retrieved 2026-10-03 |
|---|
Portsmouth
2003 | 5.60 | Median price paid for properties divided by median gross annual full-time employee earnings of residents. This is not a household mortgage multiple, workplace earnings ratio or ratio computed from the monthly house-price index. ONS ↗Source retrieved 2026-10-03 |
|---|
Portsmouth
2004 | 6.54 | Median price paid for properties divided by median gross annual full-time employee earnings of residents. This is not a household mortgage multiple, workplace earnings ratio or ratio computed from the monthly house-price index. ONS ↗Source retrieved 2026-10-03 |
|---|
Portsmouth
2005 | 6.33 | Median price paid for properties divided by median gross annual full-time employee earnings of residents. This is not a household mortgage multiple, workplace earnings ratio or ratio computed from the monthly house-price index. ONS ↗Source retrieved 2026-10-03 |
|---|
Portsmouth
2006 | 6.54 | Median price paid for properties divided by median gross annual full-time employee earnings of residents. This is not a household mortgage multiple, workplace earnings ratio or ratio computed from the monthly house-price index. ONS ↗Source retrieved 2026-10-03 |
|---|
Portsmouth
2007 | 7.11 | Median price paid for properties divided by median gross annual full-time employee earnings of residents. This is not a household mortgage multiple, workplace earnings ratio or ratio computed from the monthly house-price index. ONS ↗Source retrieved 2026-10-03 |
|---|
Portsmouth
2008 | 7.05 | Median price paid for properties divided by median gross annual full-time employee earnings of residents. This is not a household mortgage multiple, workplace earnings ratio or ratio computed from the monthly house-price index. ONS ↗Source retrieved 2026-10-03 |
|---|
Portsmouth
2009 | 5.66 | Median price paid for properties divided by median gross annual full-time employee earnings of residents. This is not a household mortgage multiple, workplace earnings ratio or ratio computed from the monthly house-price index. ONS ↗Source retrieved 2026-10-03 |
|---|
Portsmouth
2010 | 5.89 | Median price paid for properties divided by median gross annual full-time employee earnings of residents. This is not a household mortgage multiple, workplace earnings ratio or ratio computed from the monthly house-price index. ONS ↗Source retrieved 2026-10-03 |
|---|
Portsmouth
2011 | 6.13 | Median price paid for properties divided by median gross annual full-time employee earnings of residents. This is not a household mortgage multiple, workplace earnings ratio or ratio computed from the monthly house-price index. ONS ↗Source retrieved 2026-10-03 |
|---|
Portsmouth
2012 | 6.05 | Median price paid for properties divided by median gross annual full-time employee earnings of residents. This is not a household mortgage multiple, workplace earnings ratio or ratio computed from the monthly house-price index. ONS ↗Source retrieved 2026-10-03 |
|---|
Portsmouth
2013 | 6.11 | Median price paid for properties divided by median gross annual full-time employee earnings of residents. This is not a household mortgage multiple, workplace earnings ratio or ratio computed from the monthly house-price index. ONS ↗Source retrieved 2026-10-03 |
|---|
Portsmouth
2014 | 6.19 | Median price paid for properties divided by median gross annual full-time employee earnings of residents. This is not a household mortgage multiple, workplace earnings ratio or ratio computed from the monthly house-price index. ONS ↗Source retrieved 2026-10-03 |
|---|
Portsmouth
2015 | 6.41 | Median price paid for properties divided by median gross annual full-time employee earnings of residents. This is not a household mortgage multiple, workplace earnings ratio or ratio computed from the monthly house-price index. ONS ↗Source retrieved 2026-10-03 |
|---|
Portsmouth
2016 | 7.15 | Median price paid for properties divided by median gross annual full-time employee earnings of residents. This is not a household mortgage multiple, workplace earnings ratio or ratio computed from the monthly house-price index. ONS ↗Source retrieved 2026-10-03 |
|---|
Portsmouth
2017 | 7.50 | Median price paid for properties divided by median gross annual full-time employee earnings of residents. This is not a household mortgage multiple, workplace earnings ratio or ratio computed from the monthly house-price index. ONS ↗Source retrieved 2026-10-03 |
|---|
Portsmouth
2018 | 7.66 | Median price paid for properties divided by median gross annual full-time employee earnings of residents. This is not a household mortgage multiple, workplace earnings ratio or ratio computed from the monthly house-price index. ONS ↗Source retrieved 2026-10-03 |
|---|
Portsmouth
2019 | 7.35 | Median price paid for properties divided by median gross annual full-time employee earnings of residents. This is not a household mortgage multiple, workplace earnings ratio or ratio computed from the monthly house-price index. ONS ↗Source retrieved 2026-10-03 |
|---|
Portsmouth
2020 | 8.02 | Median price paid for properties divided by median gross annual full-time employee earnings of residents. This is not a household mortgage multiple, workplace earnings ratio or ratio computed from the monthly house-price index. ONS ↗Source retrieved 2026-10-03 |
|---|
Portsmouth
2021 | 8.08 | Median price paid for properties divided by median gross annual full-time employee earnings of residents. This is not a household mortgage multiple, workplace earnings ratio or ratio computed from the monthly house-price index. ONS ↗Source retrieved 2026-10-03 |
|---|
Portsmouth
2022 | 7.73 | Median price paid for properties divided by median gross annual full-time employee earnings of residents. This is not a household mortgage multiple, workplace earnings ratio or ratio computed from the monthly house-price index. ONS ↗Source retrieved 2026-10-03 |
|---|
Portsmouth
2023 | 7.94 | Median price paid for properties divided by median gross annual full-time employee earnings of residents. This is not a household mortgage multiple, workplace earnings ratio or ratio computed from the monthly house-price index. ONS ↗Source retrieved 2026-10-03 |
|---|
Portsmouth
2024 | 7.26 | Median price paid for properties divided by median gross annual full-time employee earnings of residents. This is not a household mortgage multiple, workplace earnings ratio or ratio computed from the monthly house-price index. ONS ↗Source retrieved 2026-10-03 |
|---|
Portsmouth
2025 | 7.22 | Median price paid for properties divided by median gross annual full-time employee earnings of residents. This is not a household mortgage multiple, workplace earnings ratio or ratio computed from the monthly house-price index. ONS ↗Source retrieved 2026-10-03 |
|---|
Southampton
2002 | 5.66 | Median price paid for properties divided by median gross annual full-time employee earnings of residents. This is not a household mortgage multiple, workplace earnings ratio or ratio computed from the monthly house-price index. ONS ↗Source retrieved 2026-10-03 |
|---|
Southampton
2003 | 6.40 | Median price paid for properties divided by median gross annual full-time employee earnings of residents. This is not a household mortgage multiple, workplace earnings ratio or ratio computed from the monthly house-price index. ONS ↗Source retrieved 2026-10-03 |
|---|
Southampton
2004 | 6.64 | Median price paid for properties divided by median gross annual full-time employee earnings of residents. This is not a household mortgage multiple, workplace earnings ratio or ratio computed from the monthly house-price index. ONS ↗Source retrieved 2026-10-03 |
|---|
Southampton
2005 | 6.85 | Median price paid for properties divided by median gross annual full-time employee earnings of residents. This is not a household mortgage multiple, workplace earnings ratio or ratio computed from the monthly house-price index. ONS ↗Source retrieved 2026-10-03 |
|---|
Southampton
2006 | 6.96 | Median price paid for properties divided by median gross annual full-time employee earnings of residents. This is not a household mortgage multiple, workplace earnings ratio or ratio computed from the monthly house-price index. ONS ↗Source retrieved 2026-10-03 |
|---|
Southampton
2007 | 7.33 | Median price paid for properties divided by median gross annual full-time employee earnings of residents. This is not a household mortgage multiple, workplace earnings ratio or ratio computed from the monthly house-price index. ONS ↗Source retrieved 2026-10-03 |
|---|
Southampton
2008 | 7.31 | Median price paid for properties divided by median gross annual full-time employee earnings of residents. This is not a household mortgage multiple, workplace earnings ratio or ratio computed from the monthly house-price index. ONS ↗Source retrieved 2026-10-03 |
|---|
Southampton
2009 | 6.53 | Median price paid for properties divided by median gross annual full-time employee earnings of residents. This is not a household mortgage multiple, workplace earnings ratio or ratio computed from the monthly house-price index. ONS ↗Source retrieved 2026-10-03 |
|---|
Southampton
2010 | 6.92 | Median price paid for properties divided by median gross annual full-time employee earnings of residents. This is not a household mortgage multiple, workplace earnings ratio or ratio computed from the monthly house-price index. ONS ↗Source retrieved 2026-10-03 |
|---|
Southampton
2011 | 6.79 | Median price paid for properties divided by median gross annual full-time employee earnings of residents. This is not a household mortgage multiple, workplace earnings ratio or ratio computed from the monthly house-price index. ONS ↗Source retrieved 2026-10-03 |
|---|
Southampton
2012 | 6.58 | Median price paid for properties divided by median gross annual full-time employee earnings of residents. This is not a household mortgage multiple, workplace earnings ratio or ratio computed from the monthly house-price index. ONS ↗Source retrieved 2026-10-03 |
|---|
Southampton
2013 | 6.48 | Median price paid for properties divided by median gross annual full-time employee earnings of residents. This is not a household mortgage multiple, workplace earnings ratio or ratio computed from the monthly house-price index. ONS ↗Source retrieved 2026-10-03 |
|---|
Southampton
2014 | 6.75 | Median price paid for properties divided by median gross annual full-time employee earnings of residents. This is not a household mortgage multiple, workplace earnings ratio or ratio computed from the monthly house-price index. ONS ↗Source retrieved 2026-10-03 |
|---|
Southampton
2015 | 6.92 | Median price paid for properties divided by median gross annual full-time employee earnings of residents. This is not a household mortgage multiple, workplace earnings ratio or ratio computed from the monthly house-price index. ONS ↗Source retrieved 2026-10-03 |
|---|
Southampton
2016 | 7.18 | Median price paid for properties divided by median gross annual full-time employee earnings of residents. This is not a household mortgage multiple, workplace earnings ratio or ratio computed from the monthly house-price index. ONS ↗Source retrieved 2026-10-03 |
|---|
Southampton
2017 | 7.47 | Median price paid for properties divided by median gross annual full-time employee earnings of residents. This is not a household mortgage multiple, workplace earnings ratio or ratio computed from the monthly house-price index. ONS ↗Source retrieved 2026-10-03 |
|---|
Southampton
2018 | 8.03 | Median price paid for properties divided by median gross annual full-time employee earnings of residents. This is not a household mortgage multiple, workplace earnings ratio or ratio computed from the monthly house-price index. ONS ↗Source retrieved 2026-10-03 |
|---|
Southampton
2019 | 7.50 | Median price paid for properties divided by median gross annual full-time employee earnings of residents. This is not a household mortgage multiple, workplace earnings ratio or ratio computed from the monthly house-price index. ONS ↗Source retrieved 2026-10-03 |
|---|
Southampton
2020 | 7.35 | Median price paid for properties divided by median gross annual full-time employee earnings of residents. This is not a household mortgage multiple, workplace earnings ratio or ratio computed from the monthly house-price index. ONS ↗Source retrieved 2026-10-03 |
|---|
Southampton
2021 | 7.52 | Median price paid for properties divided by median gross annual full-time employee earnings of residents. This is not a household mortgage multiple, workplace earnings ratio or ratio computed from the monthly house-price index. ONS ↗Source retrieved 2026-10-03 |
|---|
Southampton
2022 | 7.46 | Median price paid for properties divided by median gross annual full-time employee earnings of residents. This is not a household mortgage multiple, workplace earnings ratio or ratio computed from the monthly house-price index. ONS ↗Source retrieved 2026-10-03 |
|---|
Southampton
2023 | 7.54 | Median price paid for properties divided by median gross annual full-time employee earnings of residents. This is not a household mortgage multiple, workplace earnings ratio or ratio computed from the monthly house-price index. ONS ↗Source retrieved 2026-10-03 |
|---|
Southampton
2024 | 7.23 | Median price paid for properties divided by median gross annual full-time employee earnings of residents. This is not a household mortgage multiple, workplace earnings ratio or ratio computed from the monthly house-price index. ONS ↗Source retrieved 2026-10-03 |
|---|
Southampton
2025 | 7.00 | Median price paid for properties divided by median gross annual full-time employee earnings of residents. This is not a household mortgage multiple, workplace earnings ratio or ratio computed from the monthly house-price index. ONS ↗Source retrieved 2026-10-03 |
|---|
England
2002 | 5.11 | Median price paid for properties divided by median gross annual full-time employee earnings of residents. This is not a household mortgage multiple, workplace earnings ratio or ratio computed from the monthly house-price index. ONS ↗Source retrieved 2026-10-03 |
|---|
England
2003 | 5.93 | Median price paid for properties divided by median gross annual full-time employee earnings of residents. This is not a household mortgage multiple, workplace earnings ratio or ratio computed from the monthly house-price index. ONS ↗Source retrieved 2026-10-03 |
|---|
England
2004 | 6.60 | Median price paid for properties divided by median gross annual full-time employee earnings of residents. This is not a household mortgage multiple, workplace earnings ratio or ratio computed from the monthly house-price index. ONS ↗Source retrieved 2026-10-03 |
|---|
England
2005 | 6.78 | Median price paid for properties divided by median gross annual full-time employee earnings of residents. This is not a household mortgage multiple, workplace earnings ratio or ratio computed from the monthly house-price index. ONS ↗Source retrieved 2026-10-03 |
|---|
England
2006 | 6.95 | Median price paid for properties divided by median gross annual full-time employee earnings of residents. This is not a household mortgage multiple, workplace earnings ratio or ratio computed from the monthly house-price index. ONS ↗Source retrieved 2026-10-03 |
|---|
England
2007 | 7.14 | Median price paid for properties divided by median gross annual full-time employee earnings of residents. This is not a household mortgage multiple, workplace earnings ratio or ratio computed from the monthly house-price index. ONS ↗Source retrieved 2026-10-03 |
|---|
England
2008 | 6.96 | Median price paid for properties divided by median gross annual full-time employee earnings of residents. This is not a household mortgage multiple, workplace earnings ratio or ratio computed from the monthly house-price index. ONS ↗Source retrieved 2026-10-03 |
|---|
England
2009 | 6.40 | Median price paid for properties divided by median gross annual full-time employee earnings of residents. This is not a household mortgage multiple, workplace earnings ratio or ratio computed from the monthly house-price index. ONS ↗Source retrieved 2026-10-03 |
|---|
England
2010 | 6.85 | Median price paid for properties divided by median gross annual full-time employee earnings of residents. This is not a household mortgage multiple, workplace earnings ratio or ratio computed from the monthly house-price index. ONS ↗Source retrieved 2026-10-03 |
|---|
England
2011 | 6.79 | Median price paid for properties divided by median gross annual full-time employee earnings of residents. This is not a household mortgage multiple, workplace earnings ratio or ratio computed from the monthly house-price index. ONS ↗Source retrieved 2026-10-03 |
|---|
England
2012 | 6.77 | Median price paid for properties divided by median gross annual full-time employee earnings of residents. This is not a household mortgage multiple, workplace earnings ratio or ratio computed from the monthly house-price index. ONS ↗Source retrieved 2026-10-03 |
|---|
England
2013 | 6.76 | Median price paid for properties divided by median gross annual full-time employee earnings of residents. This is not a household mortgage multiple, workplace earnings ratio or ratio computed from the monthly house-price index. ONS ↗Source retrieved 2026-10-03 |
|---|
England
2014 | 7.09 | Median price paid for properties divided by median gross annual full-time employee earnings of residents. This is not a household mortgage multiple, workplace earnings ratio or ratio computed from the monthly house-price index. ONS ↗Source retrieved 2026-10-03 |
|---|
England
2015 | 7.54 | Median price paid for properties divided by median gross annual full-time employee earnings of residents. This is not a household mortgage multiple, workplace earnings ratio or ratio computed from the monthly house-price index. ONS ↗Source retrieved 2026-10-03 |
|---|
England
2016 | 7.72 | Median price paid for properties divided by median gross annual full-time employee earnings of residents. This is not a household mortgage multiple, workplace earnings ratio or ratio computed from the monthly house-price index. ONS ↗Source retrieved 2026-10-03 |
|---|
England
2017 | 7.91 | Median price paid for properties divided by median gross annual full-time employee earnings of residents. This is not a household mortgage multiple, workplace earnings ratio or ratio computed from the monthly house-price index. ONS ↗Source retrieved 2026-10-03 |
|---|
England
2018 | 8.04 | Median price paid for properties divided by median gross annual full-time employee earnings of residents. This is not a household mortgage multiple, workplace earnings ratio or ratio computed from the monthly house-price index. ONS ↗Source retrieved 2026-10-03 |
|---|
England
2019 | 7.88 | Median price paid for properties divided by median gross annual full-time employee earnings of residents. This is not a household mortgage multiple, workplace earnings ratio or ratio computed from the monthly house-price index. ONS ↗Source retrieved 2026-10-03 |
|---|
England
2020 | 7.87 | Median price paid for properties divided by median gross annual full-time employee earnings of residents. This is not a household mortgage multiple, workplace earnings ratio or ratio computed from the monthly house-price index. ONS ↗Source retrieved 2026-10-03 |
|---|
England
2021 | 9.06 | Median price paid for properties divided by median gross annual full-time employee earnings of residents. This is not a household mortgage multiple, workplace earnings ratio or ratio computed from the monthly house-price index. ONS ↗Source retrieved 2026-10-03 |
|---|
England
2022 | 8.56 | Median price paid for properties divided by median gross annual full-time employee earnings of residents. This is not a household mortgage multiple, workplace earnings ratio or ratio computed from the monthly house-price index. ONS ↗Source retrieved 2026-10-03 |
|---|
England
2023 | 8.45 | Median price paid for properties divided by median gross annual full-time employee earnings of residents. This is not a household mortgage multiple, workplace earnings ratio or ratio computed from the monthly house-price index. ONS ↗Source retrieved 2026-10-03 |
|---|
England
2024 | 7.84 | Median price paid for properties divided by median gross annual full-time employee earnings of residents. This is not a household mortgage multiple, workplace earnings ratio or ratio computed from the monthly house-price index. ONS ↗Source retrieved 2026-10-03 |
|---|
England
2025 | 7.64 | Median price paid for properties divided by median gross annual full-time employee earnings of residents. This is not a household mortgage multiple, workplace earnings ratio or ratio computed from the monthly house-price index. ONS ↗Source retrieved 2026-10-03 |
|---|