Skip to content
Facts CountEdition: PortsmouthChange place
or browse all wards

Find your area

Portsmouth · Poverty and deprivation · part of Living standards

Poverty and deprivation in Portsmouth

The short answer

Neighbourhoods in England's most deprived 10% in Portsmouth: 12% (IoD2025), 2 percentage points higher than England (10%).

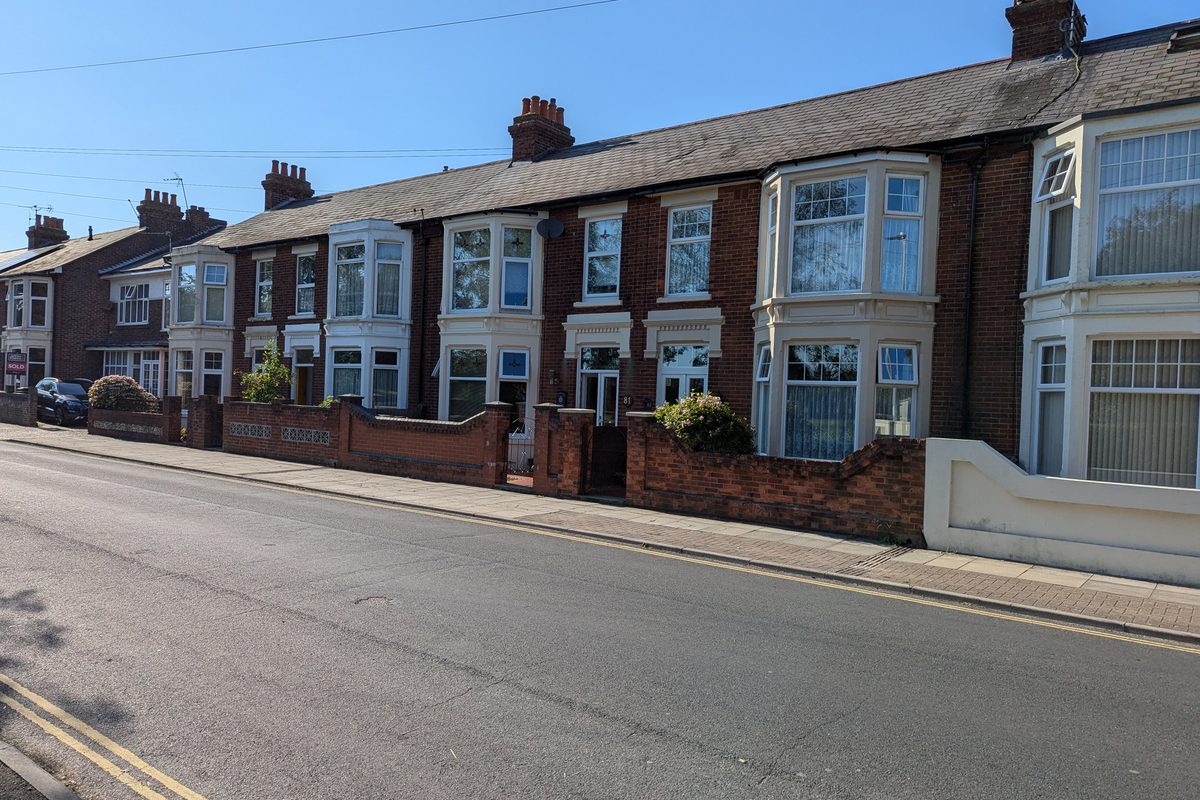
A row of red-brick terraced houses with white bay windows and low front walls along Mayfield Road, Portsmouth, on a sunny day
Terraced houses on Mayfield Road, North End. Photo: TCExplorer, CC BY-SA 2.0, via Wikimedia Commons

Neighbourhoods in England's most deprived 10%: how Portsmouth compares

What share of Portsmouth's neighbourhoods are among the most deprived 10% in England on the 2025 Index of Multiple Deprivation?

Official statistics

See the full comparison data
Neighbourhoods in England's most deprived 10% · % of neighbourhoods (LSOAs)
PeriodPortsmouthSouthamptonChichesterWinchesterEngland
IoD202512%11.8%0%0%10%

Definition: Share of 2021 Lower layer Super Output Areas in the area whose 2025 Index of Multiple Deprivation rank puts them in decile 1 for England (1 = most deprived). Counted from the published LSOA deciles in File 1. Ward values use the ONS best-fit LSOA (2021) to ward (May 2024) lookup: each neighbourhood counts wholly in one ward.

  • The Index of Multiple Deprivation ranks every small area in England against every other. It shows relative position, not how much deprivation there is.
  • MHCLG says the indices cannot measure absolute change in deprivation over time. A higher share in one edition can mean other places improved faster.
  • Neighbourhoods are 2021 Lower layer Super Output Areas (about 1,500 people each). Portsmouth has 125 of them.
  • Ward figures rest on a best-fit lookup. A neighbourhood that straddles a ward boundary is counted in the ward holding most of its people.
  • Wards have between about 7 and 11 neighbourhoods, so one neighbourhood changes a ward share by roughly 10 percentage points.
  • The 10% share for every city council area shown reproduces the figure MHCLG publishes in File 10 (checked by this script).

What the numbers do and don’t tell you

Deprivation rankings show position, not amount

The Index of Multiple Deprivation ranks neighbourhoods against each other. MHCLG says it cannot measure absolute change over time, and a neighbourhood ranked 100th is not twice as deprived as one ranked 200th. If Portsmouth moves up or down the table, that can be because other places changed, not Portsmouth.

Some deprivation scores are real proportions

The income, employment, children's and older people's income scores are actual shares of people (a score of 0.21 means 21% of people aged 60 and over are income deprived). The overall index score is not a share of anyone.

Universal Credit changed who counts as a claimant

Under Universal Credit a wider group of people must look for work than under Jobseeker's Allowance. DWP says this pushes the claimant count up, and ONS has said the count is no longer a reliable economic indicator on its own. That is why the pre-2013 and post-2013 lines are kept apart.

4 more notes, including long-run changes

Universal Credit arrived in Portsmouth later than in Southampton

DWP moved Southampton's jobcentre to the full Universal Credit service in February 2017 and Portsmouth's and Cosham's in September 2018. Until then only simpler claims went onto Universal Credit, so for those years Portsmouth's lower Universal Credit numbers reflect the timetable, not less need.

Fuel poverty depends on the home as well as the income

Under the current definition a household is only counted as fuel poor if its home is rated energy efficiency band D or below. DESNZ estimates for councils are modelled and should be used for broad patterns, not detailed trends; below council level they are not robust.

Food bank figures count one network

Trussell counts parcels from its own food banks, by where they are given out. Hundreds of independent food banks are not included, so a low or zero figure can mean there is no Trussell food bank nearby rather than low need.

Local crisis support changed in April 2026

The Household Support Fund has been followed by the Crisis and Resilience Fund, government money given to councils from 1 April 2026 to 31 March 2029 to help low-income households in financial crisis. Portsmouth City Council runs crisis payments under it.

Measures by subject

Neighbourhoods in England's most deprived 10%: ward by ward

Neighbourhoods in England's most deprived 10% · % of neighbourhoods (LSOAs) · IoD2025
WardValue
Charles Dickens72.7%
Paulsgrove33.3%
Nelson20%
Fratton11.1%
St Thomas11.1%
Baffins0%
Central Southsea0%
Copnor0%
Cosham0%
Drayton and Farlington0%
Eastney and Craneswater0%
Hilsea0%
Milton0%
St Jude0%

What is being done

Official commitments only, with their status from dated evidence. A completed action is not proof the figures above improved.

  • Approved Portsmouth City Council: Deliver the Skills and Labour Market Strategy 2026-2030 through annual action plans with key performance indicators. evidence 2026-03 ↗
  • In progress Portsmouth City Council (government Crisis and Resilience Fund): Run the Crisis and Resilience Fund from 1 April 2026 to 31 March 2029: crisis payments, housing payments, grants to local resilience services and community coordination. evidence 2026-10-13 ↗
  • Completed Portsmouth International Port (council-owned): Extend the cruise and ferry terminal with Levelling Up Fund money. evidence 2026-10-17 ↗
  • Approved UK Government (Ministry of Housing, Communities and Local Government), with neighbourhood boards in Landport and Paulsgrove: Fund neighbourhood regeneration in Landport and Paulsgrove through ten-year plans set by resident-led neighbourhood boards. The programme allows up to £20 million per place over ten years. evidence 2026-11-10 ↗
  • In progress Health and Wellbeing Board (Tackling Poverty Partnership Group): Deliver twelve tasks under four priorities: maximising household income, strengthening the local safety net, increasing opportunities and improving wellbeing, and using data to support partnership working. evidence 2026-09-23 ↗
  • In progress Portsmouth City Council (lead of a 32-council consortium, funded by the Department for Energy Security and Net Zero): Lead the Warm Homes: Local Grant for Portsmouth and 31 other councils, paying for home energy improvements, delivered locally by Switched On Portsmouth. evidence 2026-11-10 ↗
  • In progress Portsmouth City Council (accountable body for the Solent area, funded by the Department for Work and Pensions): Run Connect to Work across the Solent area (Portsmouth, Southampton and the Isle of Wight): up to 12 months of support to find and keep work for disabled people, people with health conditions and people with complex barriers to work. evidence 2026-11-10 ↗
  • Approved UK Government (Ministry of Housing, Communities and Local Government) for the Hampshire and the Solent Combined County Authority: Fund the Hampshire and the Solent Combined County Authority’s investment fund at £44.6 million a year for 30 years once a mayor is in post, with a third of the annual amount in each of 2026/27 and 2027/28. evidence 2026-06-03 ↗
  • In progress Portsmouth City Council with the University of Portsmouth and HIVE Portsmouth: Build the council’s capacity to use research on the wider causes of ill health, including community researchers and evidence to inform council decisions. evidence 2026-06 ↗

Trend, commitments and gaps for this issue →

Who can act

See what could change in Portsmouth → · Your councillors and MPs →

Support & Services

What we couldn’t find yet (5)

These figures would help residents but are not published for Portsmouth in a form we can check and refresh automatically.

  • Index of Multiple Deprivation 2010 (and 2004, 2007) council summaries. The 2010 council summaries are published only as legacy .xls workbooks, which this standard-library fetcher cannot read reliably. Not substituted. MHCLG, https://www.gov.uk/government/statistics/english-indices-of-deprivation-2010 ("local authority summaries" .xls). Add with a reviewed .xls reader or an ODS/CSV re-publication.
  • Share of people in relative low income (all ages) for Portsmouth. The official household income survey (Households Below Average Income) is too small for council figures. Child low income by ward is covered on the children and families page. DWP publishes Households Below Average Income for regions only. Children in Low Income Families local statistics (Stat-Xplore and published tables) cover children.
  • Food parcels from independent food banks. No official or complete count exists. Trussell figures cover only its own network; independent food banks report separately and not by council area. Independent Food Aid Network (IFAN) surveys members but does not publish council-level parcel counts. Ask local food banks directly.
  • Fuel poverty by ward. DESNZ publishes neighbourhood estimates but says estimates below council level are not robust, so ward totals are not built here. DESNZ sub-regional fuel poverty tables (Table 4, LSOA). Use only to spot unusually high or low areas, as DESNZ advises.
  • Council Tax Support caseload in Portsmouth. Not yet added to this topic. MHCLG Council Taxbase statistics include council tax reduction caseload by billing authority; Portsmouth City Council holds local scheme data (FOI to the council).
Sources and method

Comparison places are chosen automatically: the three nearest official cities, and the three most similar cities in the ONS area classification (cities whose council areas have a similar population make-up), plus England. Where a measure is only published for whole counties, cities inside a county are left out rather than replaced by the county.

Figures are fetched by a script from the official source and shown unchanged. Comparisons use the same definition and period for every place. Rates and shares change in percentage points; counts and levels change in per cent. An increase is not automatically good or bad.

All the data in this topic

The retained source collection contains 0 records for this topic, including comparison areas and older releases. Each record keeps its own period and source date. Current findings above may use newer releases; a later page update does not refresh every record.

Browse 0 measures and their sources

Source downloads and methods →