Skip to content
Facts CountEdition: PortsmouthChange place
or browse all wards

Find your area

Portsmouth · Children and families

Children and families in Portsmouth

The short answer

Children in care in Portsmouth: 93 per 10,000 children (2025), 26 per 10,000 children aged under 18 higher than England (67); up 2 per 10,000 children aged under 18 since 2021 (91).

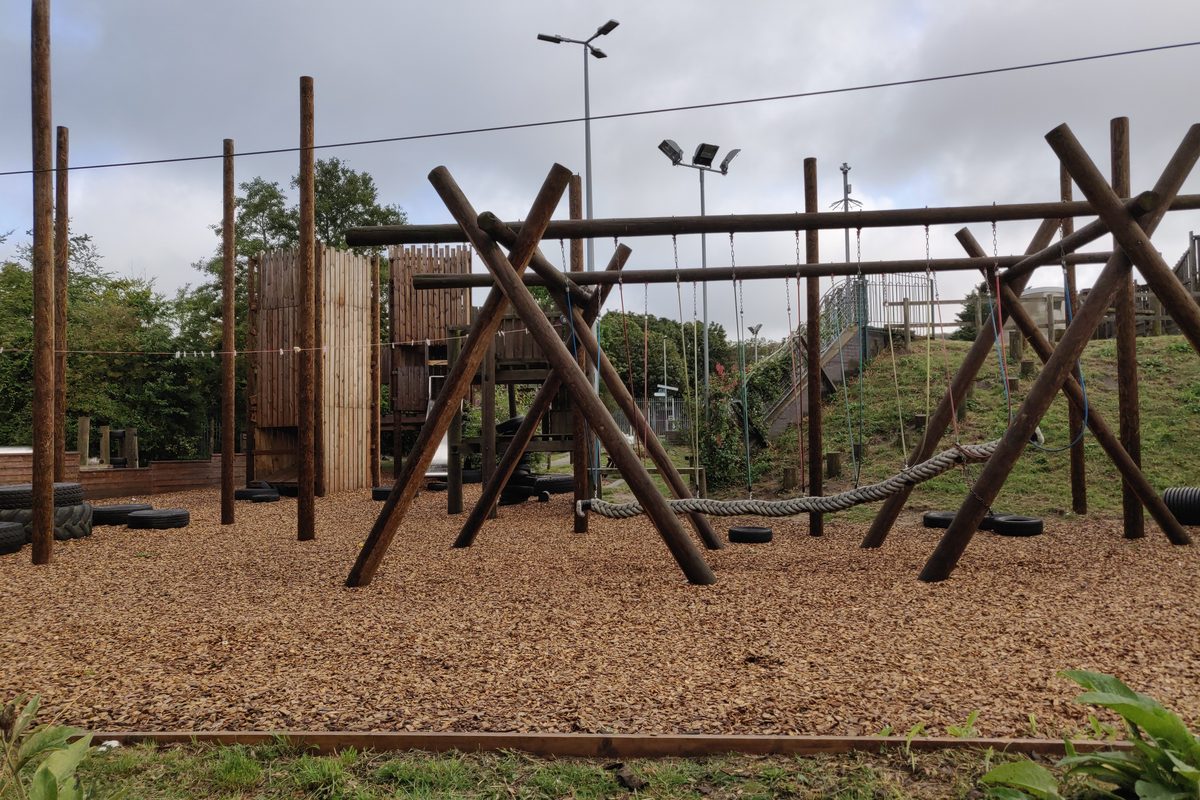
Empty wooden climbing frames, rope bridge and swings on bark chippings at Paulsgrove Adventure Playground
Paulsgrove Adventure Playground. Photo: Tim Sheerman-Chase, CC BY 2.0, via Wikimedia Commons

Children in care: how Portsmouth compares

How many children does the council look after (children in care), for every 10,000 children living here?

Official statistics

Children in care

2021 to 2025

Portsmouth · children looked after per 10,000 children aged under 18

Reviewed figures: 2021 to 2025.

Shown on this chart: From 2021 to 2025, children in care rose by 2.2% in Portsmouth and fell by 2.9% in England.

Both places compared over 2021 to 2025, using matching published dates.

Compared areas: Portsmouth; England.

Actual values

PortsmouthEngland

Each line joins consecutive published observations for that place. Missing dates remain gaps.

See the full comparison data
Children in care · children looked after per 10,000 children aged under 18
PeriodPortsmouthSouthamptonSouth EastEngland
202593 children looked after per 10,000 children aged under 1890 children looked after per 10,000 children aged under 1855 children looked after per 10,000 children aged under 1867 children looked after per 10,000 children aged under 18
202494 children looked after per 10,000 children aged under 1897 children looked after per 10,000 children aged under 1856 children looked after per 10,000 children aged under 1869 children looked after per 10,000 children aged under 18
202392 children looked after per 10,000 children aged under 18108 children looked after per 10,000 children aged under 1857 children looked after per 10,000 children aged under 1870 children looked after per 10,000 children aged under 18
202293 children looked after per 10,000 children aged under 18114 children looked after per 10,000 children aged under 1856 children looked after per 10,000 children aged under 1870 children looked after per 10,000 children aged under 18
202191 children looked after per 10,000 children aged under 18100 children looked after per 10,000 children aged under 1854 children looked after per 10,000 children aged under 1869 children looked after per 10,000 children aged under 18

Definition: Children looked after by the council on 31 March of each year, per 10,000 children aged under 18. Includes children in foster care, children's homes, placed with parents or relatives, and unaccompanied children seeking asylum. Rate as published by DfE.

  • A higher rate is not on its own a sign of better or worse services. It reflects need, how early families are helped, local practice and court decisions.
  • Unaccompanied children seeking asylum are included; their numbers can move a council's rate.
  • Rates are rounded to whole numbers by DfE. Earlier years in this file may differ slightly from older releases because DfE revises counts and population estimates.
  • Other comparison cities not shown: Chichester is part of West Sussex; this measure is only published for the whole county. Winchester is part of Hampshire; this measure is only published for the whole county.. A county figure is never shown in place of a city.

What the numbers do and don’t tell you

Care rates vary a lot between councils

DfE notes that rates of children in care vary widely between councils, from 27 to 184 per 10,000 children in 2025. A higher rate can reflect more need, different thresholds for stepping in, earlier or later help for families, and court decisions, so it is not a score.

Why councils differ is not fully understood

The National Audit Office reported in January 2019 that the Department for Education did not fully understand what drives demand for children's social care, or why activity and costs vary so widely between councils. Comparisons between Portsmouth and Southampton should be read with that in mind.

Why free school meal eligibility keeps rising

Since 1 April 2018, pupils who become eligible for free school meals keep that eligibility while Universal Credit is rolled out, even if their family's circumstances change. DfE says this is the main reason the share of eligible pupils has risen each year. Eligibility is also being widened from the 2026/27 school year, which the January 2026 figures do not yet show.

8 more notes, including long-run changes

Early years results changed basis in 2021

The early years foundation stage profile was reformed in 2021. DfE says results from 2021/22 are not directly comparable with earlier years, so this page starts in 2021/22.

Official after-housing-costs child poverty figures are new

DWP's March 2026 release added after-housing-costs figures to its local child poverty statistics for the first time (FYE 2024 and FYE 2025) and revised its earlier figures. In Portsmouth in FYE 2025, 31.0% of children under 16 were in low-income families after housing costs, compared with 20.7% before housing costs: a gap of 10.3 percentage points.

Portsmouth's family hubs

Portsmouth has five family hubs, in Buckland, Milton Park, Northern Parade, Somerstown and Paulsgrove. They bring together health, early help, education and community services for families from pregnancy to young adulthood, and families can use any hub.

Ofsted no longer gives councils an overall children's services grade

For inspections from 1 April 2026, Ofsted removed the overall effectiveness judgement. It still grades help and protection, children in care, care leavers and the impact of leaders. So Portsmouth's July 2026 inspection has no overall grade, while Southampton's 2023 inspection does.

Ofsted: Portsmouth City Council children's services, latest inspection

Ofsted's latest full inspection of Portsmouth City Council's children's services began on 06 July 2026 (report published 18 August 2026). Judgements: Impact of leaders on social work practice: Outstanding; Children who need help and protection: Outstanding; Children in care: Outstanding; Care leavers: Outstanding. No overall grade was given: Ofsted stopped giving an overall effectiveness judgement for inspections from 1 April 2026.

Ofsted: Portsmouth City Council children's services, earlier inspections

Earlier full inspections, newest first: inspection starting 15 May 2023 (ILACS framework, published 03 July 2023): overall Good (Impact of leaders on social work practice Good, Children who need help and protection Outstanding, Children in care Good, Care leavers Requires improvement to be good); inspection starting 03 September 2018 (ILACS framework, published 15 October 2018): overall Good (Impact of leaders on social work practice Good, Children who need help and protection Good, Children in care and care leavers Good); inspection starting 25 June 2014 (single inspection framework, published 01 September 2014): overall Requires improvement (Children who need help and protection Requires improvement, Children looked after and achieving permanence Good, Adoption performance Good, Care leavers Requires improvement, Leadership, management and governance Good). Ofsted grades are categories, not scores, and the frameworks changed in 2018 and 2026, so grades from different frameworks are not directly comparable.

Ofsted: Southampton City Council children's services, latest inspection

Ofsted's latest full inspection of Southampton City Council's children's services began on 05 June 2023 (report published 28 July 2023). Judgements: Impact of leaders on social work practice: Outstanding; Children who need help and protection: Good; Children in care: Good; Care leavers: Good. Overall effectiveness: Good.

Ofsted: Southampton City Council children's services, earlier inspections

Earlier full inspections, newest first: inspection starting 18 November 2019 (ILACS framework, published 09 January 2020): overall Requires improvement to be good (Impact of leaders on social work practice Requires improvement to be good, Children who need help and protection Requires improvement to be good, Children in care and care leavers Requires improvement to be good); inspection starting 08 July 2014 (single inspection framework, published 15 September 2014): overall Requires improvement (Children who need help and protection Requires improvement, Children looked after and achieving permanence Requires improvement, Adoption performance Requires improvement, Care leavers Inadequate, Leadership, management and governance Requires improvement). Ofsted grades are categories, not scores, and the frameworks changed in 2018 and 2026, so grades from different frameworks are not directly comparable.

More measures

Portsmouth

Children in care, earlier years (2018 to 2020)

107 children looked after per 10,000 children aged under 18 2020

40 per 10,000 children aged under 18 higher than England (67).

Up 13 per 10,000 children aged under 18 since 2018 (94).

Official statistics

Trend, comparison and definition

What this answers: Before the latest release, how many children did the council look after per 10,000 children?

Children in care, earlier years (2018 to 2020)

2018 to 2020

Portsmouth · children looked after per 10,000 children aged under 18

Reviewed figures: 2018 to 2020.

Shown on this chart: From 2018 to 2020, children in care, earlier years (2018 to 2020) rose by 13.8% in Portsmouth and rose by 4.7% in England.

Both places compared over 2018 to 2020, using matching published dates.

Compared areas: Portsmouth; England.

Actual values

PortsmouthEngland

Each line joins consecutive published observations for that place. Missing dates remain gaps.

Children in care, earlier years (2018 to 2020) · children looked after per 10,000 children aged under 18
PeriodPortsmouthSouthamptonSouth EastEngland
2020107 children looked after per 10,000 children aged under 1895 children looked after per 10,000 children aged under 1853 children looked after per 10,000 children aged under 1867 children looked after per 10,000 children aged under 18
2019111 children looked after per 10,000 children aged under 1895 children looked after per 10,000 children aged under 1852 children looked after per 10,000 children aged under 1865 children looked after per 10,000 children aged under 18
201894 children looked after per 10,000 children aged under 18104 children looked after per 10,000 children aged under 1851 children looked after per 10,000 children aged under 1864 children looked after per 10,000 children aged under 18

Definition: Children looked after by the council on 31 March of each year, per 10,000 children aged under 18. Includes children in foster care, children's homes, placed with parents or relatives, and unaccompanied children seeking asylum. Rate as published by DfE.

  • A higher rate is not on its own a sign of better or worse services. It reflects need, how early families are helped, local practice and court decisions.
  • Unaccompanied children seeking asylum are included; their numbers can move a council's rate.
  • These years come from DfE's 2022 release, which used older population estimates. Do not join them to the latest series as one line.
  • Other comparison cities not shown: Chichester is part of West Sussex; this measure is only published for the whole county. Winchester is part of Hampshire; this measure is only published for the whole county.. A county figure is never shown in place of a city.

Series breaks: 2021: The latest DfE release starts here; this earlier-release series stops the year before.

Portsmouth

Children in need of help from children's social care

382 children in need per 10,000 children aged under 18 2025

52 per 10,000 children aged under 18 higher than England (330).

Up 75 per 10,000 children aged under 18 since 2013 (307).

Official statistics

Trend, comparison and definition

What this answers: How many children were getting help from council children's social care as 'children in need' on 31 March, per 10,000 children?

Children in need of help from children's social care

2013 to 2025

Portsmouth · children in need per 10,000 children aged under 18

Reviewed figures: 2013 to 2025.

Shown on this chart: From 2013 to 2025, children in need of help from children's social care rose by 24.2% in Portsmouth and fell by 0.4% in England.

Both places compared over 2013 to 2025, using matching published dates.

Compared areas: Portsmouth; England.

Actual values

PortsmouthEngland

Each line joins consecutive published observations for that place. Missing dates remain gaps.

Children in need of help from children's social care · children in need per 10,000 children aged under 18
PeriodPortsmouthSouthamptonSouth EastEngland
2025382 children in need per 10,000 children aged under 18387 children in need per 10,000 children aged under 18314 children in need per 10,000 children aged under 18330 children in need per 10,000 children aged under 18
2024433 children in need per 10,000 children aged under 18407 children in need per 10,000 children aged under 18315 children in need per 10,000 children aged under 18331 children in need per 10,000 children aged under 18
2023391 children in need per 10,000 children aged under 18518 children in need per 10,000 children aged under 18330 children in need per 10,000 children aged under 18339 children in need per 10,000 children aged under 18
2022419 children in need per 10,000 children aged under 18587 children in need per 10,000 children aged under 18337 children in need per 10,000 children aged under 18344 children in need per 10,000 children aged under 18
2021390 children in need per 10,000 children aged under 18444 children in need per 10,000 children aged under 18310 children in need per 10,000 children aged under 18330 children in need per 10,000 children aged under 18
2020395 children in need per 10,000 children aged under 18485 children in need per 10,000 children aged under 18311 children in need per 10,000 children aged under 18330 children in need per 10,000 children aged under 18
2019388 children in need per 10,000 children aged under 18539 children in need per 10,000 children aged under 18309 children in need per 10,000 children aged under 18340 children in need per 10,000 children aged under 18
2018410 children in need per 10,000 children aged under 18487 children in need per 10,000 children aged under 18322 children in need per 10,000 children aged under 18345 children in need per 10,000 children aged under 18
2017336 children in need per 10,000 children aged under 18468 children in need per 10,000 children aged under 18304 children in need per 10,000 children aged under 18333 children in need per 10,000 children aged under 18
2016312 children in need per 10,000 children aged under 18714 children in need per 10,000 children aged under 18305 children in need per 10,000 children aged under 18340 children in need per 10,000 children aged under 18
2015338 children in need per 10,000 children aged under 18282 children in need per 10,000 children aged under 18282 children in need per 10,000 children aged under 18338 children in need per 10,000 children aged under 18
2014314 children in need per 10,000 children aged under 18411 children in need per 10,000 children aged under 18282 children in need per 10,000 children aged under 18345 children in need per 10,000 children aged under 18
2013307 children in need per 10,000 children aged under 18452 children in need per 10,000 children aged under 18262 children in need per 10,000 children aged under 18332 children in need per 10,000 children aged under 18

Definition: A child in need is a child the council has assessed as needing its services to be safe, healthy or to develop well. It includes children in care and children on child protection plans. Rate computed by Pompey Counts from DfE's count of children on 31 March and the ONS mid-year population of children aged 0 to 17 that DfE publishes in the same release, using the previous mid-year (for example, 2025 uses mid-2024), which is how DfE calculates its own national rate. The script checks the method reproduces every published national rate.

  • Rates reflect how councils decide who needs support as well as how much need there is.
  • Population source: ONS mid-year population estimates (same release, SHA-256 46d7e5e4fcb8…).
  • Other comparison cities not shown: Chichester is part of West Sussex; this measure is only published for the whole county. Winchester is part of Hampshire; this measure is only published for the whole county.. A county figure is never shown in place of a city.

Portsmouth

Children on a child protection plan

49.9 children on a child protection plan per 10,000 children aged under 18 2025

9.3 per 10,000 children aged under 18 higher than England (40.6).

Up 6.5 per 10,000 children aged under 18 since 2013 (43.4).

Official statistics

Trend, comparison and definition

What this answers: How many children were on a child protection plan on 31 March, per 10,000 children?

Children on a child protection plan

2013 to 2025

Portsmouth · children on a child protection plan per 10,000 children aged under 18

Reviewed figures: 2013 to 2025.

Shown on this chart: From 2013 to 2025, children on a child protection plan rose by 15% in Portsmouth and rose by 7.1% in England.

Both places compared over 2013 to 2025, using matching published dates.

Compared areas: Portsmouth; England.

Actual values

PortsmouthEngland

Each line joins consecutive published observations for that place. Missing dates remain gaps.

Children on a child protection plan · children on a child protection plan per 10,000 children aged under 18
PeriodPortsmouthSouthamptonSouth EastEngland
202549.9 children on a child protection plan per 10,000 children aged under 1857.3 children on a child protection plan per 10,000 children aged under 1837.7 children on a child protection plan per 10,000 children aged under 1840.6 children on a child protection plan per 10,000 children aged under 18
202453.2 children on a child protection plan per 10,000 children aged under 1854.6 children on a child protection plan per 10,000 children aged under 1837.5 children on a child protection plan per 10,000 children aged under 1841.4 children on a child protection plan per 10,000 children aged under 18
202342 children on a child protection plan per 10,000 children aged under 1863 children on a child protection plan per 10,000 children aged under 1842.2 children on a child protection plan per 10,000 children aged under 1842.7 children on a child protection plan per 10,000 children aged under 18
202254.3 children on a child protection plan per 10,000 children aged under 1896.2 children on a child protection plan per 10,000 children aged under 1844.2 children on a child protection plan per 10,000 children aged under 1843.3 children on a child protection plan per 10,000 children aged under 18
202160.9 children on a child protection plan per 10,000 children aged under 1862.3 children on a child protection plan per 10,000 children aged under 1841.3 children on a child protection plan per 10,000 children aged under 1842.4 children on a child protection plan per 10,000 children aged under 18
202048.3 children on a child protection plan per 10,000 children aged under 1879.9 children on a child protection plan per 10,000 children aged under 1842.1 children on a child protection plan per 10,000 children aged under 1843.7 children on a child protection plan per 10,000 children aged under 18
201945.9 children on a child protection plan per 10,000 children aged under 1861.8 children on a child protection plan per 10,000 children aged under 1842.2 children on a child protection plan per 10,000 children aged under 1844.5 children on a child protection plan per 10,000 children aged under 18
201867 children on a child protection plan per 10,000 children aged under 1865.9 children on a child protection plan per 10,000 children aged under 1846.8 children on a child protection plan per 10,000 children aged under 1845.9 children on a child protection plan per 10,000 children aged under 18
201756.7 children on a child protection plan per 10,000 children aged under 1856.5 children on a child protection plan per 10,000 children aged under 1841.7 children on a child protection plan per 10,000 children aged under 1843.8 children on a child protection plan per 10,000 children aged under 18
201664.5 children on a child protection plan per 10,000 children aged under 1869 children on a child protection plan per 10,000 children aged under 1842.4 children on a child protection plan per 10,000 children aged under 1843.4 children on a child protection plan per 10,000 children aged under 18
201554.6 children on a child protection plan per 10,000 children aged under 1867.7 children on a child protection plan per 10,000 children aged under 1841.2 children on a child protection plan per 10,000 children aged under 1843.1 children on a child protection plan per 10,000 children aged under 18
201455.4 children on a child protection plan per 10,000 children aged under 1849.7 children on a child protection plan per 10,000 children aged under 1838.2 children on a child protection plan per 10,000 children aged under 1842.1 children on a child protection plan per 10,000 children aged under 18
201343.4 children on a child protection plan per 10,000 children aged under 1849.5 children on a child protection plan per 10,000 children aged under 1832.3 children on a child protection plan per 10,000 children aged under 1837.9 children on a child protection plan per 10,000 children aged under 18

Definition: A child protection plan is made when a child protection conference decides a child is at risk of significant harm. Rate computed by Pompey Counts from DfE's count of children on 31 March and the ONS mid-year population of children aged 0 to 17 that DfE publishes in the same release, using the previous mid-year (for example, 2025 uses mid-2024), which is how DfE calculates its own national rate. The script checks the method reproduces every published national rate.

  • Small numbers: in Portsmouth, a change of a few dozen children moves the rate by several points.
  • Rates reflect local practice and thresholds as well as risk.
  • Population source: ONS mid-year population estimates (same release, SHA-256 46d7e5e4fcb8…).
  • Other comparison cities not shown: Chichester is part of West Sussex; this measure is only published for the whole county. Winchester is part of Hampshire; this measure is only published for the whole county.. A county figure is never shown in place of a city.

Portsmouth

Care leavers aged 19 to 21 in education, work or training

51% 2025

3 percentage points lower than England (54%).

Up 5 percentage points since 2021 (46%).

Official statistics

Trend, comparison and definition

What this answers: Of young people aged 19 to 21 who left the council's care, what share were in education, employment or training around their birthday?

Care leavers aged 19 to 21 in education, work or training

2021 to 2025

Portsmouth · %

Reviewed figures: 2021 to 2025.

Shown on this chart: From 2021 to 2025, care leavers aged 19 to 21 in education, work or training rose by 5 percentage points in Portsmouth and rose by 2 percentage points in England.

Both places compared over 2021 to 2025, using matching published dates.

Compared areas: Portsmouth; England.

Actual values

PortsmouthEngland

Each line joins consecutive published observations for that place. Missing dates remain gaps.

Care leavers aged 19 to 21 in education, work or training · % of care leavers aged 19 to 21
PeriodPortsmouthSouthamptonSouth EastEngland
202551%55%52%54%
202452%45%51%54%
202354%46%57%56%
202255%44%57%55%
202146%36%51%52%

Definition: Young people who were looked after for at least 13 weeks after their 14th birthday, including some time after turning 16, whose main activity around their birthday in the year to 31 March was education, employment or training. Percentage as published by DfE (whole numbers).

  • The rest are not in education, work or training, or the council does not know their activity. A fall in 'not known' can change this share without any change in what young people are doing.
  • Portsmouth's figures cover about 200 young people, so the share can move by several points from year to year.
  • Raw file is 3.3 MB, so it is identified by URL and SHA-256 rather than kept.
  • Other comparison cities not shown: Chichester is part of West Sussex; this measure is only published for the whole county. Winchester is part of Hampshire; this measure is only published for the whole county.. A county figure is never shown in place of a city.

Portsmouth

Children in low-income families (before housing costs)

20.7% FYE 2025

0.9 percentage points higher than England (19.8%).

Up 0.3 percentage points since FYE 2022 (20.4%).

Official statistics

Trend, comparison and definition

What this answers: What share of children under 16 live in families on relatively low income, before rent or mortgage costs are taken off?

Children in low-income families (before housing costs) · % of children aged under 16
PeriodPortsmouthSouthamptonChichesterWinchesterSouth EastEngland
FYE 202520.7%21.8%13.3%8.9%13%19.8%
FYE 202420.1%21.5%12.2%8.5%12.5%19.3%
FYE 202320.9%22.5%13.6%8.9%13.1%19.9%
FYE 202220.4%20.8%12.1%8.1%12.2%18.6%

Definition: Children aged under 16 in families whose equivalised household income before housing costs is below 60% of the UK median for that year (relative low income), from DWP's local area statistics. FYE means financial year ending (FYE 2025 = April 2024 to March 2025). England is derived from the English regions in the same table.

  • Counts only families who claimed Child Benefit and at least one other benefit (Universal Credit, tax credits or Housing Benefit) during the year, then calibrated to the national Households Below Average Income survey total. So it is an official statistic built from benefit records, not a survey of every family.
  • Rates divide by mid-year population estimates for children under 16; DWP warns some local percentages should be read with care.
  • DWP revised the back series in this release. Years before FYE 2022 are not available on a consistent basis in the published tables, so they are not shown.
  • Raw workbook is 3.2 MB, so it is identified by URL and SHA-256 rather than kept.
  • Ward figures use May 2024 ward boundaries and older ward population estimates; DWP advises care with ward percentages.
  • Checked against DWP Stat-Xplore (BHC relative low income, children aged 0 to 15, one place per query): Stat-Xplore holds the same years (FYE 2022 to FYE 2025) and its counts match the published tables for all 8 places and years to within 3 children (largest gap: England FYE 2025, 2,130,679 vs 2,130,682); Stat-Xplore applies its own disclosure control, so tiny differences are expected. It has no earlier years on this basis, so nothing is joined.

Series breaks: FYE 2022: Start of DWP's revised series (March 2026). Neither the published tables nor Stat-Xplore hold revised figures for earlier years; the earlier release (FYE 2015 to 2024, old method) is a separate measure.

Portsmouth

Children in low-income families before housing costs, earlier DWP basis (FYE 2015 to 2024)

23.4% FYE 2024

1.3 percentage points higher than England (22.1%).

Up 6.6 percentage points since FYE 2015 (16.8%).

Official statistics

Trend, comparison and definition

What this answers: How did the share of children under 16 in low-income families change from 2014/15 to 2023/24, on the basis DWP used until March 2025?

Children in low-income families before housing costs, earlier DWP basis (FYE 2015 to 2024) · % of children aged under 16
PeriodPortsmouthSouthamptonChichesterWinchesterSouth EastEngland
FYE 202423.4%24.8%14%9.5%14.5%22.1%
FYE 202322.7%24.1%14.4%9.3%14%21.3%
FYE 202221.2%21.6%12.3%8.3%12.8%19.3%
FYE 202119.9%20.7%12.1%8.5%12.8%18.6%
FYE 202023.1%23.6%13.9%9.5%14.3%21.1%
FYE 201919%20%11.9%8%12.1%18.2%
FYE 201820%21.5%11.9%8.5%13%19.4%
FYE 201717.8%18%10.1%7.3%11.3%17.1%
FYE 201617.8%18.4%10.9%8%11.5%17.2%
FYE 201516.8%17.7%10.6%7.6%11%16.1%

Definition: Children aged under 16 in families whose equivalised income before housing costs is below 60% of the UK median (relative low income), from DWP's March 2025 local area release covering FYE 2015 to FYE 2024. This is the release before DWP revised its method in March 2026. England is derived from the English regions in the same table.

  • This is an older release on an earlier method. DWP's March 2026 release revised every year it covers and starts at FYE 2022; those revised figures are the main measure above.
  • Do not join this line to the revised line, or compare a year here with a year there: for the years both releases cover they give different figures (for example South East FYE 2022: 219,646 children here, 210,530 in the revised release).
  • DWP has not published revised figures for FYE 2015 to 2021: the GOV.UK tables and Stat-Xplore both hold only FYE 2022 onwards on the new basis (Stat-Xplore checked by this script on each run).
  • Rates use the population estimates available in early 2025; for wards DWP used mid-2022 estimates as a proxy for FYE 2024, and wards are on May 2022 boundaries.
  • Counts only families who claimed Child Benefit and at least one other benefit (Universal Credit, tax credits or Housing Benefit), calibrated to the national survey total.
  • Raw workbook is 3.4 MB, so it is identified by URL and SHA-256 rather than kept.

Series breaks: FYE 2024: Series ends FYE 2024; DWP replaced this release in March 2026 with a revised series from FYE 2022 (separate measure).

Portsmouth

Children in low-income families (after housing costs)

31% FYE 2025

3.9 percentage points higher than England (27.1%).

Down 0.7 percentage points since FYE 2024 (31.7%).

Official statistics

Trend, comparison and definition

What this answers: What share of children under 16 live in families on relatively low income once rent or mortgage costs are paid?

Children in low-income families (after housing costs) · % of children aged under 16
PeriodPortsmouthSouthamptonChichesterWinchesterSouth EastEngland
FYE 202531%31%23%15.3%20.8%27.1%
FYE 202431.7%32.1%21.8%14.7%21%27.4%

Definition: As the before-housing-costs measure, but with housing costs deducted from income first. DWP first published this as an official local statistic in March 2026, for FYE 2024 onwards. England is derived from the English regions in the same table.

  • Counts only families who claimed Child Benefit and at least one other benefit (Universal Credit, tax credits or Housing Benefit) during the year, then calibrated to the national Households Below Average Income survey total. So it is an official statistic built from benefit records, not a survey of every family.
  • Rates divide by mid-year population estimates for children under 16; DWP warns some local percentages should be read with care.
  • DWP revised the back series in this release. Years before FYE 2022 are not available on a consistent basis in the published tables, so they are not shown.
  • Raw workbook is 3.2 MB, so it is identified by URL and SHA-256 rather than kept.
  • DWP publishes this only from FYE 2024 because too many families had unknown housing costs before then.
  • Other after-housing-costs local estimates (for example the End Child Poverty Coalition's, produced by Loughborough University) use a different model and are not official statistics; do not compare them with these figures.

Series breaks: FYE 2024: First year DWP publishes after-housing-costs local figures.

Schools located in Portsmouth City Council's area; some pupils live outside the city.

Pupils eligible for free school meals

37.2% 2025/26

11 percentage points higher than England (26.5%), calculated from unrounded figures.

Up 19 percentage points since 2015/16 (18.7%).

Official statistics

Trend, comparison and definition

What this answers: What share of pupils at schools in the city were eligible for free school meals at the January school census?

Pupils eligible for free school meals

2015/16 to 2025/26

Portsmouth · %

Reviewed figures: 2015/16 to 2025/26.

Shown on this chart: From 2015/16 to 2025/26, pupils eligible for free school meals rose by 18.5 percentage points in Portsmouth and rose by 12.2 percentage points in England.

Both places compared over 2015/16 to 2025/26, using matching published dates.

Compared areas: Portsmouth; England.

Actual values

PortsmouthEngland

Each line joins consecutive published observations for that place. Missing dates remain gaps.

Pupils eligible for free school meals · % of pupils
PeriodPortsmouthSouthamptonSouth EastEngland
2025/2637.2%38.8%21.1%26.5%
2024/2535.5%37.9%20.6%25.7%
2023/2434.3%35.1%19.7%24.6%
2022/2333.4%34%18.8%23.8%
2021/2232.1%33%17.6%22.5%
2020/2130.1%30.4%16%20.8%
2019/2024.7%24.7%12.9%17.3%
2018/1921.4%21.9%11.2%15.4%
2017/1818.6%18.7%9.4%13.6%
2016/1718.5%17.6%9.6%14%
2015/1618.7%18.4%9.9%14.3%

Definition: Pupils known to be eligible for free school meals on census day in January, as a share of all pupils in state-funded nursery, primary, secondary, special and alternative provision schools and non-maintained special schools in the council area (where the school is, not where the pupil lives). This is eligibility, not whether the meal was taken.

  • Since April 2018, pupils who become eligible keep eligibility while Universal Credit is rolled out, even if family income rises. DfE says this protection is the main reason the share keeps rising, so the rise is not only a rise in poverty.
  • From the 2026/27 school year, eligibility is being extended; DfE says the January 2026 figures do not reflect the new rules.
  • Raw file is 20 MB, so it is identified by URL and SHA-256 rather than kept.
  • Other comparison cities not shown: Chichester is part of West Sussex; this measure is only published for the whole county. Winchester is part of Hampshire; this measure is only published for the whole county.. A county figure is never shown in place of a city.

Series breaks: 2018/19: Universal Credit transitional protection started on 1 April 2018. The definition did not change, but the share rises faster from here partly because fewer pupils leave eligibility.

Schools located in Portsmouth City Council's area; some pupils live outside the city.

Pupils missing at least half of their school sessions

3.6% 2024/25

1.2 percentage points higher than England (2.4%).

Up 2.2 percentage points since 2006/07 (1.4%).

Up 2.4 percentage points in the last ten years (from 1.2% in 2014/15).

Official statistics

Trend, comparison and definition

What this answers: What share of pupil enrolments missed 50% or more of possible sessions across the academic year?

Pupils missing at least half of their school sessions

2006/07 to 2024/25

Portsmouth · %

Reviewed figures: 2006/07 to 2024/25.

Shown on this chart: From 2006/07 to 2024/25, pupils missing at least half of their school sessions rose by 2.2 percentage points in Portsmouth and rose by 1.4 percentage points in England.

Both places compared over 2006/07 to 2024/25, using matching published dates.

Compared areas: Portsmouth; England.

Actual values

PortsmouthEngland

Each line joins consecutive published observations for that place. Missing dates remain gaps.

Pupils missing at least half of their school sessions · % of pupil enrolments
PeriodPortsmouthSouthamptonSouth EastEngland
2024/253.6%3.4%2.5%2.4%
2023/243.2%3%2.3%2.3%
2022/233%2.5%2.1%2%
2021/222.3%2.1%1.6%1.7%
2020/211.8%1.5%1%1.1%
2019/20––––
2018/191.7%1%0.8%0.9%
2017/181.5%0.9%0.8%0.8%
2016/171.3%0.8%0.7%0.7%
2015/161.2%0.9%0.6%0.6%
2014/151.2%1%0.6%0.6%
2013/141.2%0.9%0.6%0.6%
2012/131.2%1%0.6%0.6%
2011/121.4%1.1%0.6%0.6%
2010/111.1%1.2%0.6%0.7%
2009/101.3%1.4%0.7%0.7%
2008/091.4%1.7%0.8%0.8%
2007/081.6%1.7%0.8%0.9%
2006/071.4%2.2%0.9%1%

Definition: Pupil enrolments aged 5 to 15 who missed 50% or more of their possible sessions across the full academic year, as a share of enrolments in state-funded primary, state-funded secondary and special schools (all phases combined, 'Total'). Council area of the school, not where the pupil lives. Absence of any kind counts, authorised or unauthorised.

  • No full-year figures were published for 2019/20. Any change that spans that year is across a gap in the series, not a one-year change.
  • 2020/21 and 2021/22 were affected by the pandemic and its restrictions, so they are not a normal baseline.
  • These figures count enrolments, not children: a pupil with more than one enrolment can appear more than once. Absence does not say why a child was away.
  • Raw file is 6 MB, so it is identified by URL and SHA-256 rather than kept.
  • Other comparison cities not shown: Chichester is part of West Sussex; this measure is only published for the whole county. Winchester is part of Hampshire; this measure is only published for the whole county.. A county figure is never shown in place of a city.

Series breaks: 2019/20: No full-year figures were published.

Portsmouth

Children with a good level of development at the end of Reception

70.6% 2025/26

1.7 percentage points lower than England (72.3%).

Up 8.6 percentage points since 2021/22 (62%).

Official statistics

Trend, comparison and definition

What this answers: What share of children reached the expected level in the main areas of early learning by the end of their Reception year (age 5)?

Children with a good level of development at the end of Reception

2021/22 to 2025/26

Portsmouth · %

Reviewed figures: 2021/22 to 2025/26.

Shown on this chart: From 2021/22 to 2025/26, children with a good level of development at the end of Reception rose by 8.6 percentage points in Portsmouth and rose by 7.1 percentage points in England.

Both places compared over 2021/22 to 2025/26, using matching published dates.

Compared areas: Portsmouth; England.

Actual values

PortsmouthEngland

Each line joins consecutive published observations for that place. Missing dates remain gaps.

Children with a good level of development at the end of Reception · % of children assessed
PeriodPortsmouthSouthamptonSouth EastEngland
2025/2670.6%70%74.7%72.3%
2024/2565.5%68.1%70.7%68.3%
2023/2465.2%66.6%69.8%67.7%
2022/2365.1%66.9%69.6%67.2%
2021/2262%61.8%67.5%65.2%

Definition: Children at the expected level in the 12 early learning goals for communication and language, personal, social and emotional development, physical development, literacy and mathematics, as assessed by teachers at the end of Reception (the early years foundation stage profile). Council area of the school or setting.

  • This is a teacher assessment, not a test.
  • DfE says results from 2021/22 are not directly comparable with earlier years because the profile changed significantly in 2021.
  • Raw file is 25 MB, so it is identified by URL and SHA-256 rather than kept.
  • Other comparison cities not shown: Chichester is part of West Sussex; this measure is only published for the whole county. Winchester is part of Hampshire; this measure is only published for the whole county.. A county figure is never shown in place of a city.

Series breaks: 2021/22: The early years foundation stage profile was reformed in September 2021. Results before 2021/22 (last collected 2018/19; none in 2019/20 or 2020/21) are on a different basis and are not shown.

Portsmouth

Young people entering the youth justice system for the first time

161 first-time entrants per 100,000 aged 10 to 17 2025

34 per 100,000 aged 10 to 17 higher than England (127).

Down 529 per 100,000 aged 10 to 17 since 2014 (690).

Official statistics

Trend, comparison and definition

What this answers: How many 10 to 17 year olds living here received their first youth caution or conviction in the year, per 100,000 young people of that age?

Young people entering the youth justice system for the first time

2014 to 2025

Portsmouth · first-time entrants per 100,000 aged 10 to 17

Reviewed figures: 2014 to 2025.

Shown on this chart: From 2014 to 2025, young people entering the youth justice system for the first time fell by 76.7% in Portsmouth and fell by 69.4% in England.

Both places compared over 2014 to 2025, using matching published dates.

Compared areas: Portsmouth; England.

Actual values

PortsmouthEngland

Each line joins consecutive published observations for that place. Missing dates remain gaps.

Young people entering the youth justice system for the first time · first-time entrants per 100,000 aged 10 to 17
PeriodPortsmouthSouthamptonSouth EastEngland
2025161 first-time entrants per 100,000 aged 10 to 17126 first-time entrants per 100,000 aged 10 to 1797.6 first-time entrants per 100,000 aged 10 to 17127 first-time entrants per 100,000 aged 10 to 17
2024215 first-time entrants per 100,000 aged 10 to 17136 first-time entrants per 100,000 aged 10 to 17118 first-time entrants per 100,000 aged 10 to 17139 first-time entrants per 100,000 aged 10 to 17
2023234 first-time entrants per 100,000 aged 10 to 17147 first-time entrants per 100,000 aged 10 to 17139 first-time entrants per 100,000 aged 10 to 17146 first-time entrants per 100,000 aged 10 to 17
2022218 first-time entrants per 100,000 aged 10 to 17189 first-time entrants per 100,000 aged 10 to 17137 first-time entrants per 100,000 aged 10 to 17152 first-time entrants per 100,000 aged 10 to 17
2021311 first-time entrants per 100,000 aged 10 to 17187 first-time entrants per 100,000 aged 10 to 17139 first-time entrants per 100,000 aged 10 to 17151 first-time entrants per 100,000 aged 10 to 17
2020323 first-time entrants per 100,000 aged 10 to 17344 first-time entrants per 100,000 aged 10 to 17163 first-time entrants per 100,000 aged 10 to 17173 first-time entrants per 100,000 aged 10 to 17
2019489 first-time entrants per 100,000 aged 10 to 17338 first-time entrants per 100,000 aged 10 to 17174 first-time entrants per 100,000 aged 10 to 17217 first-time entrants per 100,000 aged 10 to 17
2018431 first-time entrants per 100,000 aged 10 to 17386 first-time entrants per 100,000 aged 10 to 17173 first-time entrants per 100,000 aged 10 to 17244 first-time entrants per 100,000 aged 10 to 17
2017425 first-time entrants per 100,000 aged 10 to 17465 first-time entrants per 100,000 aged 10 to 17218 first-time entrants per 100,000 aged 10 to 17300 first-time entrants per 100,000 aged 10 to 17
2016510 first-time entrants per 100,000 aged 10 to 17368 first-time entrants per 100,000 aged 10 to 17237 first-time entrants per 100,000 aged 10 to 17334 first-time entrants per 100,000 aged 10 to 17
2015296 first-time entrants per 100,000 aged 10 to 17497 first-time entrants per 100,000 aged 10 to 17300 first-time entrants per 100,000 aged 10 to 17377 first-time entrants per 100,000 aged 10 to 17
2014690 first-time entrants per 100,000 aged 10 to 17575 first-time entrants per 100,000 aged 10 to 17354 first-time entrants per 100,000 aged 10 to 17415 first-time entrants per 100,000 aged 10 to 17

Definition: Rate of 10 to 17 year olds receiving their first reprimand, warning or conviction per 100,000 population. Numerator from the Ministry of Justice (Police National Computer), denominator ONS mid-year population (previous year), by council area of residence, as published by the Office for Health Improvement and Disparities. 95% confidence limits as published.

  • Counts are estimates: young people are placed in a council area from the home postcode on the Police National Computer, or by a model where none is recorded, so counts are not whole numbers.
  • Fewer first-time entrants can reflect more out-of-court diversion and police practice as well as less offending.
  • South East figures come from the Fingertips regional file (SHA-256 30e08bc430db…).
  • Other comparison cities not shown: Chichester is part of West Sussex; this measure is only published for the whole county. Winchester is part of Hampshire; this measure is only published for the whole county.. A county figure is never shown in place of a city.

Children in low-income families (before housing costs): ward by ward

Children in low-income families (before housing costs) · % of children aged under 16 · FYE 2025
WardValue
Charles Dickens38.7%
St Thomas31.7%
Paulsgrove27.8%
Nelson23.4%
Fratton23.3%
Cosham17.5%
Central Southsea16.5%
St Jude15.9%
Baffins15.4%
Copnor15.2%
Hilsea14.4%
Eastney and Craneswater13.3%
Milton13.2%
Drayton and Farlington7.6%

Who can act

  • Portsmouth City Council (children's services) — Legal duties to safeguard children in need, to look after children in care, to support care leavers to age 25, to run early help and family hubs, and to lead the youth justice service with partners.
  • Portsmouth Safeguarding Children Partnership — The council, Hampshire and Isle of Wight Integrated Care Board and Hampshire and Isle of Wight Constabulary jointly arrange and check how agencies keep children safe in the city.
  • Schools and early years settings in Portsmouth — Record free school meal eligibility at the school census, carry out the Reception-year early years assessment, and act on safeguarding concerns.
  • Ofsted — Inspects the council's children's services and reports publicly.

See what could change in Portsmouth → · Your councillors and MPs →

Support & Services

What we couldn’t find yet (5)

These figures would help residents but are not published for Portsmouth in a form we can check and refresh automatically.

  • Waiting times for children's mental health services (CAMHS) in Portsmouth. Not published for the city. NHS England publishes children and young people's mental health access figures for integrated care boards, not for council areas, and not as waiting times by service. It could be requested under the Freedom of Information Act: Freedom of Information request to Hampshire and Isle of Wight Healthcare NHS Foundation Trust (which now runs Portsmouth CAMHS; it absorbed Solent NHS Trust), asking for referral-to-treatment waits for Portsmouth CAMHS by month.
  • Children in care rate before 2018 on one consistent release. DfE's local tables in each release cover only about five years, and each release revises counts and population estimates. Joining releases would splice different revisions. Older figures (from 2009/10) are in DfE's archived statistical first releases on GOV.UK ('Children looked after in England including adoption'); use them only as separate, labelled series.
  • Children in low-income families for FYE 2015 to 2021 on DWP's revised (March 2026) basis. DWP revised its method in March 2026 and republished only FYE 2022 onwards. Stat-Xplore holds the same four years (checked with the Open Data API on the retrieval date). The FYE 2015 to 2024 figures on the old method are shown as a separate measure, not joined. Ask DWP (Children in Low Income Families statistics team, via the contact on the GOV.UK release page) whether the revised back series will be published; until then only the old-method series exists for those years.
  • Ofsted judgements as a chart. Ofsted grades are categories, not numbers, and the framework changed in 2018 and April 2026 (no overall grade). They are given as dated context instead of a trend line. Report PDFs are listed on Ofsted's provider pages for Portsmouth (provider 80539) and Southampton (provider 80558).
  • Children and families getting early help from the council. DfE does not collect or publish early help numbers by council. It could be requested under the Freedom of Information Act: Freedom of Information request to Portsmouth City Council for the number of families and children with an open early help assessment at 31 March each year.
Sources and method

Comparison places are chosen automatically: the three nearest official cities, and the three most similar cities in the ONS area classification (cities whose council areas have a similar population make-up), plus England. Where a measure is only published for whole counties, cities inside a county are left out rather than replaced by the county.

Figures are fetched by a script from the official source and shown unchanged. Comparisons use the same definition and period for every place. Rates and shares change in percentage points; counts and levels change in per cent. An increase is not automatically good or bad.

All the data in this topic

The retained source collection contains 0 records for this topic, including comparison areas and older releases. Each record keeps its own period and source date. Current findings above may use newer releases; a later page update does not refresh every record.

Browse 0 measures and their sources

Source downloads and methods →