
Skip to content
Facts CountEdition: PortsmouthChange place
or browse all wards

Find your area

Portsmouth · Homelessness and home conditions · part of Homes and housing

Homelessness and home conditions in Portsmouth

The short answer

Households in temporary accommodation, per 1,000 households in Portsmouth: 6.9 per 1,000 households (31 March 2026), 1.3 per 1,000 households higher than England (5.5), calculated from unrounded figures; up 5.6 per 1,000 households since 30 September 2018 (1.2).

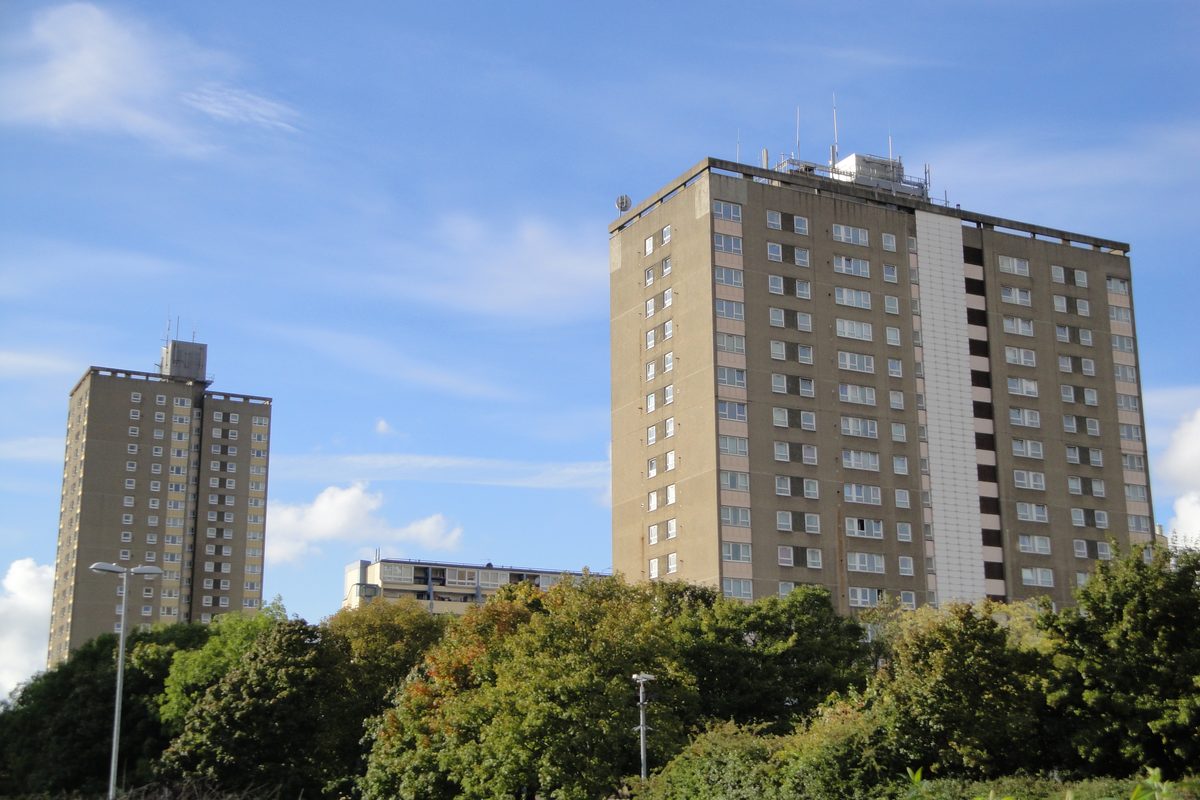
Two 1970s council tower blocks in Somerstown, Ladywood House and Arthur Pope House, above a line of trees under a blue sky
Council tower blocks in Somerstown. Photo: Editor5807, CC BY 3.0, via Wikimedia Commons

Households in temporary accommodation, per 1,000 households: how Portsmouth compares

Out of every 1,000 households, how many were living in temporary accommodation arranged by the council at the end of each quarter?

Official statistics

Households in temporary accommodation, per 1,000 households

September 2018 to March 2026

Portsmouth · per 1,000 households

Reviewed figures: September 2018 to March 2026.

Shown on this chart: From September 2018 to March 2026, households in temporary accommodation, per 1,000 households rose by 452.4% in Portsmouth and rose by 53.2% in England.

Both places compared over September 2018 to March 2026, using matching published dates.

Compared areas: Portsmouth; England.

Actual values

PortsmouthEngland

Each line joins consecutive published observations for that place. Missing dates remain gaps.

  • 324 households with children in temporary accommodation (31 March 2026)
The numbers over time (1)

Households with children in temporary accommodation

Households with children in temporary accommodation

September 2018 to March 2026

Portsmouth · households

Reviewed figures: September 2018 to March 2026.

Shown on this chart: From September 2018 to March 2026, households with children in temporary accommodation rose by 320.8% in Portsmouth and rose by 40.1% in England.

Both places compared over September 2018 to March 2026, using matching published dates.

Compared areas: Portsmouth; England.

Actual values

PortsmouthEngland

Each line joins consecutive published observations for that place. Missing dates remain gaps.

Households with children in temporary accommodation · households
PeriodPortsmouthSouthamptonChichesterWinchesterSouth EastEngland
31 March 2026324 households313 households55 households29 households9,640 households86,460 households
31 December 2025316 households309 households47 households36 households9,490 households85,760 households
30 September 2025303 households305 households44 households34 households9,750 households85,710 households
30 June 2025290 households281 households–33 households9,440 households84,220 households
31 March 2025293 households293 households24 households33 households9,570 households82,990 households
31 December 2024249 households268 households21 households33 households8,880 households81,030 households
30 September 2024252 households271 households30 households32 households9,030 households80,490 households
30 June 2024230 households257 households20 households31 households8,580 households78,380 households
31 March 2024184 households227 households21 households30 households8,100 households74,490 households
31 December 2023149 households228 households10 households24 households7,500 households71,270 households
30 September 2023112 households203 households23 households23 households7,190 households69,630 households
30 June 2023111 households207 households21 households21 households6,760 households68,150 households
31 March 2023143 households212 households21 households17 households6,740 households64,990 households
31 December 2022118 households195 households24 households17 households6,310 households61,980 households
30 September 2022106 households185 households31 households12 households6,340 households61,760 households
30 June 202288 households182 households28 households10 households6,050 households59,810 households
31 March 202257 households127 households29 households9 households5,620 households58,880 households
31 December 202162 households126 households–9 households5,670 households58,540 households
30 September 202165 households136 households20 households10 households5,620 households58,320 households
30 June 202161 households124 households18 households9 households5,460 households60,000 households
31 March 202149 households137 households–11 households5,270 households59,300 households
31 December 202062 households149 households17 households13 households5,440 households59,440 households
30 September 202068 households143 households16 households16 households5,390 households60,240 households
30 June 202053 households149 households24 households21 households5,650 households62,680 households
31 March 202059 households146 households20 households22 households5,580 households62,970 households
31 December 201973 households136 households16 households23 households5,550 households62,560 households
30 September 201969 households190 households–24 households5,570 households62,270 households
30 June 201973 households187 households8 households24 households6,020 households61,850 households
31 March 201964 households–6 households17 households5,950 households62,170 households
31 December 2018–211 households10 households8 households5,840 households61,610 households
30 September 201877 households177 households28 households20 households5,950 households61,730 households
30 June 2018–144 households32 households27 households6,090 households61,570 households

Number of households in temporary accommodation that include at least one dependent child, on the last day of the quarter (table TA1). MHCLG counts a household with children from the birth of the child; a household with a pregnant person and no other children is not included. This counts households, not children: the number of children is higher.

See the full comparison data
Households in temporary accommodation, per 1,000 households · per 1,000 households
PeriodPortsmouthSouthamptonChichesterWinchesterSouth EastEngland
31 March 20266.9 per 1,000 households3.8 per 1,000 households2.8 per 1,000 households1.8 per 1,000 households4.2 per 1,000 households5.5 per 1,000 households
31 December 20256.8 per 1,000 households3.9 per 1,000 households2.7 per 1,000 households1.9 per 1,000 households4.1 per 1,000 households5.5 per 1,000 households
30 September 20256.2 per 1,000 households3.8 per 1,000 households2.3 per 1,000 households1.7 per 1,000 households4.2 per 1,000 households5.5 per 1,000 households
30 June 20255.9 per 1,000 households3.5 per 1,000 households–1.6 per 1,000 households4 per 1,000 households5.4 per 1,000 households
31 March 20256.2 per 1,000 households3.6 per 1,000 households1.9 per 1,000 households1.5 per 1,000 households4.1 per 1,000 households5.4 per 1,000 households
31 December 20246 per 1,000 households3.4 per 1,000 households1.7 per 1,000 households1.3 per 1,000 households3.9 per 1,000 households5.3 per 1,000 households
30 September 20246.6 per 1,000 households3.4 per 1,000 households1.7 per 1,000 households1.3 per 1,000 households3.9 per 1,000 households5.2 per 1,000 households
30 June 20246.4 per 1,000 households3.3 per 1,000 households1.6 per 1,000 households1.1 per 1,000 households3.8 per 1,000 households5.1 per 1,000 households
31 March 20246 per 1,000 households2.9 per 1,000 households1.5 per 1,000 households1.2 per 1,000 households3.7 per 1,000 households4.9 per 1,000 households
31 December 20235.3 per 1,000 households2.9 per 1,000 households1.3 per 1,000 households0.97 per 1,000 households3.5 per 1,000 households4.7 per 1,000 households
30 September 20234.6 per 1,000 households2.5 per 1,000 households1.9 per 1,000 households0.95 per 1,000 households3.3 per 1,000 households4.5 per 1,000 households
30 June 20233.9 per 1,000 households2.5 per 1,000 households1.6 per 1,000 households0.81 per 1,000 households3.1 per 1,000 households4.4 per 1,000 households
31 March 20234.6 per 1,000 households2.5 per 1,000 households1.6 per 1,000 households0.87 per 1,000 households3.2 per 1,000 households4.4 per 1,000 households
31 December 20223.8 per 1,000 households2.4 per 1,000 households1.9 per 1,000 households0.9 per 1,000 households3.1 per 1,000 households4.2 per 1,000 households
30 September 20222.6 per 1,000 households2.1 per 1,000 households2 per 1,000 households0.78 per 1,000 households3.1 per 1,000 households4.1 per 1,000 households
30 June 20222.2 per 1,000 households2.1 per 1,000 households1.7 per 1,000 households0.68 per 1,000 households2.9 per 1,000 households4 per 1,000 households
31 March 20221.7 per 1,000 households1.5 per 1,000 households1.7 per 1,000 households0.78 per 1,000 households2.8 per 1,000 households4 per 1,000 households
31 December 20211.6 per 1,000 households1.5 per 1,000 households–0.85 per 1,000 households2.8 per 1,000 households4.1 per 1,000 households
30 September 20211.7 per 1,000 households1.6 per 1,000 households1.2 per 1,000 households0.69 per 1,000 households2.8 per 1,000 households4 per 1,000 households
30 June 20211.5 per 1,000 households1.5 per 1,000 households1 per 1,000 households0.83 per 1,000 households2.8 per 1,000 households4.1 per 1,000 households
31 March 20211.2 per 1,000 households1.6 per 1,000 households–0.92 per 1,000 households2.7 per 1,000 households4 per 1,000 households
31 December 20201.6 per 1,000 households1.8 per 1,000 households1.1 per 1,000 households0.91 per 1,000 households2.7 per 1,000 households4 per 1,000 households
30 September 20202 per 1,000 households1.7 per 1,000 households1 per 1,000 households0.97 per 1,000 households2.7 per 1,000 households4 per 1,000 households
30 June 20203.9 per 1,000 households1.8 per 1,000 households0 per 1,000 households1.1 per 1,000 households2.8 per 1,000 households4.2 per 1,000 households
31 March 20201.5 per 1,000 households1.7 per 1,000 households1.1 per 1,000 households1.1 per 1,000 households2.5 per 1,000 households3.9 per 1,000 households
31 December 20191.7 per 1,000 households1.5 per 1,000 households0.78 per 1,000 households1.1 per 1,000 households2.3 per 1,000 households3.8 per 1,000 households
30 September 20191.6 per 1,000 households2 per 1,000 households–0.91 per 1,000 households2.3 per 1,000 households3.7 per 1,000 households
30 June 20191.6 per 1,000 households2 per 1,000 households0.49 per 1,000 households0.91 per 1,000 households2.4 per 1,000 households3.7 per 1,000 households
31 March 20191.2 per 1,000 households–0.34 per 1,000 households0.89 per 1,000 households2.3 per 1,000 households3.6 per 1,000 households
31 December 2018–2.3 per 1,000 households0.45 per 1,000 households0.56 per 1,000 households2.3 per 1,000 households3.6 per 1,000 households
30 September 20181.2 per 1,000 households1.9 per 1,000 households0.96 per 1,000 households0.88 per 1,000 households2.4 per 1,000 households3.6 per 1,000 households
30 June 2018–1.6 per 1,000 households1.2 per 1,000 households1.1 per 1,000 households2.3 per 1,000 households3.6 per 1,000 households

Definition: Households in temporary accommodation (TA) arranged under homelessness law on the last day of the quarter, divided by the publisher's estimate of all households in the area (thousands). This is the rate printed in table TA1. A household counts once, whatever its size. It includes bed and breakfast, hostels, nightly-paid rooms, private-sector lets and council or housing association homes used as TA.

  • These are council returns to the national homelessness case-level collection (H-CLIC). Councils can revise them; each quarter uses the latest (often revised) file MHCLG has published.
  • England and South East totals are rounded to the nearest 10 by the publisher; council figures are not rounded.
  • The household estimate used as the denominator is updated by the publisher from time to time (different household projection or estimate bases), so small changes in the rate can come from the denominator.
  • This is a count on one day (a snapshot), not the number placed during the quarter.
  • Households are counted against the council that secured the accommodation under its homelessness duties (MHCLG definition).

What the numbers do and don’t tell you

The latest quarter in plain English

In January to March 2026 the council ended a prevention duty for 208 households (people at risk of losing their home within 56 days). 68 of them (33%) secured accommodation for six months or more; 112 (54%) were found to be homeless, which means the council then owes them a relief duty. It ended a relief duty (help for people already homeless) for 401 households. 88 (22%) secured accommodation for six months or more, and for 225 (56%) the 56 days ran out, after which the council decides whether it owes the household a main duty. On 31 March 2026, 608 households were in temporary accommodation. 320 (53%) were in council or housing association homes, 122 in nightly-paid rooms, 55 in bed and breakfast, 52 in hostels and 59 in private lets. 168 (28%) had been there for more than a year. These describe cases that closed in the quarter, not what happened to everyone who asked for help. This reading is Facts Count's, from the published government tables; the council has not published a quarterly summary.

Temporary accommodation is at a record high nationally

MHCLG reported that on 31 March 2026 there were 135,580 households in temporary accommodation in England, the highest on record, including 86,460 households with children. Portsmouth's rate has also risen since 2022, so a rise locally is part of a national pattern as well as local pressures.

The 2018 law change altered what is counted

The Homelessness Reduction Act 2017, in force from April 2018, gave councils new duties to prevent homelessness (from 56 days before it happens) and to relieve it, on top of the older main housing duty. The National Audit Office notes councils spent £2.44 billion on homelessness services in 2022-23. Figures before and after April 2018 come from different returns and should not be joined.

5 more notes, including long-run changes

Portsmouth's homelessness and rough sleeping strategy

Portsmouth City Council's Homelessness and Rough Sleeping Strategy 2024-2029 has five aims: prevent homelessness, end rough sleeping (make it rare, brief and not repeated), provide the right housing, provide the right support, and strengthen joint working. It says preventing homelessness reduces the need for temporary accommodation, which the council describes as often very expensive.

Energy certificates only cover homes that were sold, let or built

MHCLG warns that the EPC register does not hold a certificate for every home, because one is only needed when a home is sold, let or built. The A to C share therefore describes homes that changed hands that year, not every home in Portsmouth. Older owner-occupied homes that have not been sold for years are under-represented.

Council homes: the social housing regulator found serious failings

In January 2025 the Regulator of Social Housing gave Portsmouth City Council a C3 grading after finding it had failed consumer standards on safety and quality. It found over 1,000 outstanding fire safety actions, over 85% of homes without an electrical test in five years, and fewer than 40% of homes surveyed for condition in the last five years. This concerns the council's own homes as a landlord, not the private homes in the EPC figures.

Rough sleeping counts are snapshots and estimates

MHCLG says the autumn snapshot records only people seen, or thought to be, sleeping rough on one night chosen by the council between October and November, and that weather, shelters and the date all affect the number. Councils choose between a count and an estimate agreed with local agencies, and the result is checked by Homeless Link.

Waiting lists depend on each council's rules

MHCLG notes that since the Localism Act 2011 councils set their own rules on who qualifies for the housing register, and review their lists at different times; some households are on more than one list. Portsmouth's list is much shorter than Southampton's, but that difference cannot be read as less need without comparing the two councils' allocation policies.

More measures

Portsmouth

Households in temporary accommodation at 31 March, per 1,000 households (older P1E collection, 2005 to 2018)

0.92 per 1,000 households 31 March 2018

2.5 per 1,000 households lower than England (3.4), calculated from unrounded figures.

Down 0.78 per 1,000 households since 31 March 2005 (1.7).

Official statistics

Trend, comparison and definition

What this answers: Before the 2018 change in the homelessness return, how many households per 1,000 were in council-arranged temporary accommodation at the end of each financial year?

Households in temporary accommodation at 31 March, per 1,000 households (older P1E collection, 2005 to 2018)

March 2005 to March 2018

Portsmouth · per 1,000 households

Reviewed figures: March 2005 to March 2018.

Shown on this chart: From March 2005 to March 2018, households in temporary accommodation at 31 March, per 1,000 households (older P1E collection, 2005 to 2018) fell by 45.9% in Portsmouth and fell by 28.2% in England.

Both places compared over March 2005 to March 2018, using matching published dates.

Compared areas: Portsmouth; England.

Actual values

PortsmouthEngland

Each line joins consecutive published observations for that place. Missing dates remain gaps.

Households in temporary accommodation at 31 March, per 1,000 households (older P1E collection, 2005 to 2018) · per 1,000 households
PeriodPortsmouthSouthamptonChichesterWinchesterSouth EastEngland
31 March 20180.92 per 1,000 households1.6 per 1,000 households1.1 per 1,000 households0.93 per 1,000 households2.2 per 1,000 households3.4 per 1,000 households
31 March 20170.7 per 1,000 households1.6 per 1,000 households0.87 per 1,000 households0.74 per 1,000 households2.2 per 1,000 households3.3 per 1,000 households
31 March 20160.68 per 1,000 households1.7 per 1,000 households0.99 per 1,000 households0.91 per 1,000 households1.9 per 1,000 households3.1 per 1,000 households
31 March 20150.57 per 1,000 households1.3 per 1,000 households0.8 per 1,000 households0.83 per 1,000 households1.6 per 1,000 households2.9 per 1,000 households
31 March 20140.6 per 1,000 households1.3 per 1,000 households0.57 per 1,000 households0.96 per 1,000 households1.4 per 1,000 households2.6 per 1,000 households
31 March 20130.71 per 1,000 households1.3 per 1,000 households0.6 per 1,000 households0.7 per 1,000 households1.3 per 1,000 households2.5 per 1,000 households
31 March 20120.9 per 1,000 households1.5 per 1,000 households0.57 per 1,000 households0.89 per 1,000 households1.2 per 1,000 households2.3 per 1,000 households
31 March 20110.78 per 1,000 households1.4 per 1,000 households0.67 per 1,000 households0.36 per 1,000 households1.1 per 1,000 households2.2 per 1,000 households
31 March 20100.99 per 1,000 households1.3 per 1,000 households0.71 per 1,000 households0.31 per 1,000 households1 per 1,000 households2.4 per 1,000 households
31 March 20090.99 per 1,000 households1.4 per 1,000 households0.9 per 1,000 households0.79 per 1,000 households1.3 per 1,000 households3 per 1,000 households
31 March 20081.5 per 1,000 households1.7 per 1,000 households0.74 per 1,000 households1 per 1,000 households1.9 per 1,000 households3.7 per 1,000 households
31 March 20071.4 per 1,000 households2 per 1,000 households1 per 1,000 households0.87 per 1,000 households2.5 per 1,000 households4.1 per 1,000 households
31 March 20061.7 per 1,000 households2.5 per 1,000 households0.89 per 1,000 households1.1 per 1,000 households3.3 per 1,000 households4.6 per 1,000 households
31 March 20051.7 per 1,000 households2.5 per 1,000 households1.5 per 1,000 households1.2 per 1,000 households3.7 per 1,000 households4.8 per 1,000 households

Definition: Households in temporary accommodation arranged under homelessness law at 31 March (Table 784, column "Total in temporary accommodation"), divided by the household estimate (thousands) printed in the same year's sheet. Calculated here so that every year uses the same method; the publisher printed its own per-1,000 rate only from 2008-09 and the calculation matches it.

  • This is the older P1E return. It is not directly comparable with the H-CLIC series that started in April 2018, so the two are shown separately.
  • In 2004-05 to 2007-08 the household estimates in the table are rounded to the nearest thousand, so the rate for those years is less precise.
  • The file is larger than 3 MB, so only its address and SHA-256 are kept, not a copy.

Series breaks: 31 March 2018: Last P1E observation. From April 2018 the H-CLIC collection replaced P1E; see the quarterly temporary accommodation measure.

Portsmouth

Households owed help to prevent or end homelessness, per 1,000 households (each quarter)

6.7 per 1,000 households January to March 2026

3.3 per 1,000 households higher than England (3.4).

Up 4.6 per 1,000 households since April to June 2018 (2.1).

Official statistics

Trend, comparison and definition

What this answers: Out of every 1,000 households, how many were newly assessed by the council as homeless or at risk of homelessness within 56 days during the quarter?

Households owed help to prevent or end homelessness, per 1,000 households (each quarter) · per 1,000 households
PeriodPortsmouthSouthamptonChichesterWinchesterSouth EastEngland
January to March 20266.7 per 1,000 households5.5 per 1,000 households3.3 per 1,000 households2 per 1,000 households3 per 1,000 households3.4 per 1,000 households
October to December 20255.7 per 1,000 households4.6 per 1,000 households2.9 per 1,000 households1.4 per 1,000 households2.6 per 1,000 households3.2 per 1,000 households
July to September 20256.8 per 1,000 households4.7 per 1,000 households2.8 per 1,000 households1.8 per 1,000 households2.9 per 1,000 households3.4 per 1,000 households
April to June 20256.2 per 1,000 households4.2 per 1,000 households2.4 per 1,000 households1.7 per 1,000 households2.7 per 1,000 households3.3 per 1,000 households
January to March 20256.7 per 1,000 households5.1 per 1,000 households2.4 per 1,000 households2.3 per 1,000 households3 per 1,000 households3.5 per 1,000 households
October to December 20246.1 per 1,000 households4.3 per 1,000 households1.9 per 1,000 households1.6 per 1,000 households2.6 per 1,000 households3.2 per 1,000 households
July to September 20247.4 per 1,000 households4.5 per 1,000 households2.3 per 1,000 households1.9 per 1,000 households2.8 per 1,000 households3.4 per 1,000 households
April to June 20248.1 per 1,000 households4.4 per 1,000 households2.2 per 1,000 households2.3 per 1,000 households2.9 per 1,000 households3.5 per 1,000 households
January to March 20247.3 per 1,000 households5.2 per 1,000 households2.4 per 1,000 households2.6 per 1,000 households3.1 per 1,000 households3.7 per 1,000 households
October to December 20235.7 per 1,000 households4.3 per 1,000 households2 per 1,000 households1.7 per 1,000 households2.8 per 1,000 households3.4 per 1,000 households
July to September 20236.3 per 1,000 households5 per 1,000 households1.7 per 1,000 households1.7 per 1,000 households2.9 per 1,000 households3.4 per 1,000 households
April to June 20235.4 per 1,000 households4.2 per 1,000 households1.9 per 1,000 households1.4 per 1,000 households2.7 per 1,000 households3.2 per 1,000 households
January to March 20237.1 per 1,000 households4.9 per 1,000 households2.2 per 1,000 households2 per 1,000 households2.9 per 1,000 households3.4 per 1,000 households
October to December 20227.6 per 1,000 households4 per 1,000 households1.2 per 1,000 households1.9 per 1,000 households2.5 per 1,000 households3 per 1,000 households
July to September 20225.8 per 1,000 households4.5 per 1,000 households1.8 per 1,000 households1.8 per 1,000 households2.6 per 1,000 households3.1 per 1,000 households
April to June 20224.4 per 1,000 households4.4 per 1,000 households1.5 per 1,000 households1.4 per 1,000 households2.4 per 1,000 households3 per 1,000 households
January to March 20225.1 per 1,000 households4.6 per 1,000 households1.4 per 1,000 households1.5 per 1,000 households2.6 per 1,000 households3.2 per 1,000 households
October to December 20214.4 per 1,000 households3.9 per 1,000 households–1.3 per 1,000 households2.3 per 1,000 households2.8 per 1,000 households
July to September 20215.3 per 1,000 households3.9 per 1,000 households1.4 per 1,000 households1.1 per 1,000 households2.4 per 1,000 households2.9 per 1,000 households
April to June 20215.7 per 1,000 households3.4 per 1,000 households0.87 per 1,000 households1.1 per 1,000 households2.3 per 1,000 households2.8 per 1,000 households
January to March 20215.1 per 1,000 households3.3 per 1,000 households–1.4 per 1,000 households2.6 per 1,000 households3 per 1,000 households
October to December 20204.9 per 1,000 households3 per 1,000 households0.44 per 1,000 households1.3 per 1,000 households2.4 per 1,000 households2.7 per 1,000 households
July to September 20205.9 per 1,000 households3.2 per 1,000 households0.94 per 1,000 households1.5 per 1,000 households2.6 per 1,000 households3 per 1,000 households
April to June 20206.2 per 1,000 households2.6 per 1,000 households1.2 per 1,000 households1.5 per 1,000 households2.4 per 1,000 households2.8 per 1,000 households
January to March 20205.3 per 1,000 households3 per 1,000 households1.2 per 1,000 households1.8 per 1,000 households2.9 per 1,000 households3.3 per 1,000 households
October to December 20195.1 per 1,000 households2.7 per 1,000 households0.97 per 1,000 households1.8 per 1,000 households2.5 per 1,000 households2.9 per 1,000 households
July to September 20195 per 1,000 households3 per 1,000 households1.5 per 1,000 households1.8 per 1,000 households2.7 per 1,000 households3.1 per 1,000 households
April to June 20194.3 per 1,000 households2.3 per 1,000 households1.4 per 1,000 households1.4 per 1,000 households2.6 per 1,000 households3 per 1,000 households
January to March 20194.1 per 1,000 households2.8 per 1,000 households1.4 per 1,000 households1.6 per 1,000 households2.6 per 1,000 households3.1 per 1,000 households
October to December 20184 per 1,000 households2.8 per 1,000 households1.3 per 1,000 households1.3 per 1,000 households2.4 per 1,000 households2.8 per 1,000 households
July to September 20184.3 per 1,000 households2.4 per 1,000 households1.4 per 1,000 households1.7 per 1,000 households2.6 per 1,000 households2.9 per 1,000 households
April to June 20182.1 per 1,000 households3.1 per 1,000 households1.7 per 1,000 households1.3 per 1,000 households2.3 per 1,000 households2.6 per 1,000 households

Definition: Households assessed during the quarter as owed a prevention duty (threatened with homelessness within 56 days) or a relief duty (already homeless), from table A1, divided by the household estimate (thousands) printed in the same file. This equals the sum of the two per-1,000 rates the publisher prints for prevention and relief. Where an older file printed no household estimate in A1, the estimate from table TA1 of the same file is used (it is the same figure).

  • These are council returns to the national homelessness case-level collection (H-CLIC). Councils can revise them; each quarter uses the latest (often revised) file MHCLG has published.
  • England and South East totals are rounded to the nearest 10 by the publisher; council figures are not rounded.
  • The household estimate used as the denominator is updated by the publisher from time to time (different household projection or estimate bases), so small changes in the rate can come from the denominator.
  • This counts new assessments in a three-month period (a flow). It is not the number of people homeless on one day.
  • How easy it is to approach the council, and how quickly cases are assessed, affect the count as well as the level of need.

Series breaks: 30 June 2018: H-CLIC replaced the older P1E return in April 2018 after the Homelessness Reduction Act 2017. Earlier figures are a different collection and are kept as a separate measure, not joined to this series.

Portsmouth

People sleeping rough on a single autumn night, per 100,000 people

13.1 per 100,000 people Autumn 2025

4.9 per 100,000 people higher than England (8.2).

Up 11 per 100,000 people since Autumn 2010 (2.5).

Official statistics

Trend, comparison and definition

What this answers: On one night each autumn, how many people per 100,000 residents were seen or thought to be sleeping rough?

People sleeping rough on a single autumn night, per 100,000 people · per 100,000 people
PeriodPortsmouthSouthamptonChichesterWinchesterSouth EastEngland
Autumn 202513.1 per 100,000 people9.3 per 100,000 people7 per 100,000 people4.4 per 100,000 people8.3 per 100,000 people8.2 per 100,000 people
Autumn 202412.1 per 100,000 people8.5 per 100,000 people3.1 per 100,000 people3.7 per 100,000 people8.2 per 100,000 people8 per 100,000 people
Autumn 20235.1 per 100,000 people9.3 per 100,000 people2.4 per 100,000 people3.8 per 100,000 people7 per 100,000 people6.7 per 100,000 people
Autumn 20227.6 per 100,000 people10.7 per 100,000 people4 per 100,000 people3.1 per 100,000 people6.1 per 100,000 people5.4 per 100,000 people
Autumn 202111.6 per 100,000 people3.6 per 100,000 people2.4 per 100,000 people2.3 per 100,000 people4.8 per 100,000 people4.3 per 100,000 people
Autumn 202013.9 per 100,000 people7.6 per 100,000 people2.4 per 100,000 people5.6 per 100,000 people5.1 per 100,000 people4.8 per 100,000 people
Autumn 201912.4 per 100,000 people6 per 100,000 people25.2 per 100,000 people8 per 100,000 people9.8 per 100,000 people7.6 per 100,000 people
Autumn 20189 per 100,000 people11.6 per 100,000 people13.1 per 100,000 people6.5 per 100,000 people10.2 per 100,000 people8.4 per 100,000 people
Autumn 201719.9 per 100,000 people11.6 per 100,000 people8.2 per 100,000 people7.3 per 100,000 people12.3 per 100,000 people8.5 per 100,000 people
Autumn 201617.6 per 100,000 people9.2 per 100,000 people15.9 per 100,000 people3.3 per 100,000 people10.6 per 100,000 people7.5 per 100,000 people
Autumn 20157.2 per 100,000 people12.7 per 100,000 people14.4 per 100,000 people4.1 per 100,000 people9.2 per 100,000 people6.5 per 100,000 people
Autumn 20143.9 per 100,000 people7.9 per 100,000 people12 per 100,000 people11.7 per 100,000 people6.8 per 100,000 people5 per 100,000 people
Autumn 20133.4 per 100,000 people5.4 per 100,000 people16.4 per 100,000 people9.3 per 100,000 people6 per 100,000 people4.5 per 100,000 people
Autumn 20125.3 per 100,000 people7.6 per 100,000 people22.6 per 100,000 people5.9 per 100,000 people5.1 per 100,000 people4.3 per 100,000 people
Autumn 20115.4 per 100,000 people10.2 per 100,000 people13.2 per 100,000 people7.7 per 100,000 people5 per 100,000 people4.1 per 100,000 people
Autumn 20102.5 per 100,000 people2.1 per 100,000 people13.2 per 100,000 people4.3 per 100,000 people3.6 per 100,000 people3.4 per 100,000 people

Definition: The annual rough sleeping snapshot: each council picks one night between 1 October and 30 November and counts, or estimates with local partners, the people bedded down or about to bed down in the open air or in places not built for living in. Hostels and shelters are not included. The rate per 100,000 residents is printed by MHCLG (Table 5) using ONS population estimates for each year; the number of people and the council's method are in each observation note.

  • It is one night only. It does not count everyone who sleeps rough during the year, and the weather, night shelters and the date chosen all affect it.
  • Councils choose between a street count, an estimate agreed with local agencies, or an estimate that includes a spot count. Portsmouth changed method several times (see notes), so year-to-year changes in a small number can partly reflect method.
  • Numbers are small, so a change of a few people moves the rate a lot.

Portsmouth

People seen sleeping rough during the month, per 100,000 people (management information)

31.7 per 100,000 people June 2026

17 per 100,000 people higher than England (14.9), calculated from unrounded figures.

Up 11 per 100,000 people since October 2020 (20.6).

Management information

Trend, comparison and definition

What this answers: Each month, how many people per 100,000 residents did outreach services see sleeping rough at least once?

People seen sleeping rough during the month, per 100,000 people (management information)

October 2020 to June 2026

Portsmouth · per 100,000 people

Reviewed figures: October 2020 to June 2026.

Shown on this chart: From October 2020 to June 2026, people seen sleeping rough during the month, per 100,000 people (management information) rose by 53.9% in Portsmouth and rose by 79.5% in England.

Both places compared over October 2020 to June 2026, using matching published dates.

Compared areas: Portsmouth; England.

Actual values

PortsmouthEngland

Each line joins consecutive published observations for that place. Missing dates remain gaps.

People seen sleeping rough during the month, per 100,000 people (management information) · per 100,000 people
PeriodPortsmouthSouthamptonChichesterWinchesterSouth EastEngland
June 202631.7 per 100,000 people20.1 per 100,000 people4.6 per 100,000 people8.8 per 100,000 people13.4 per 100,000 people14.9 per 100,000 people
May 202629.8 per 100,000 people16.2 per 100,000 people5.4 per 100,000 people11 per 100,000 people12.6 per 100,000 people13.9 per 100,000 people
April 202623.6 per 100,000 people25.1 per 100,000 people6.9 per 100,000 people7.3 per 100,000 people12.2 per 100,000 people13.3 per 100,000 people
March 202623.2 per 100,000 people26.2 per 100,000 people5.4 per 100,000 people4.4 per 100,000 people11.4 per 100,000 people12.8 per 100,000 people
February 202620.3 per 100,000 people17.7 per 100,000 people6.1 per 100,000 people11.7 per 100,000 people11.2 per 100,000 people12.3 per 100,000 people
January 202624.6 per 100,000 people18.5 per 100,000 people10 per 100,000 people6.6 per 100,000 people11.8 per 100,000 people13.2 per 100,000 people
December 202529.3 per 100,000 people22.4 per 100,000 people6.9 per 100,000 people13.9 per 100,000 people13 per 100,000 people13.6 per 100,000 people
November 202535 per 100,000 people27.4 per 100,000 people6.9 per 100,000 people11 per 100,000 people14.7 per 100,000 people15.7 per 100,000 people
October 202531.7 per 100,000 people24.3 per 100,000 people7.7 per 100,000 people19.7 per 100,000 people14.7 per 100,000 people15.6 per 100,000 people
September 202535.9 per 100,000 people30.1 per 100,000 people4.6 per 100,000 people13.9 per 100,000 people15.4 per 100,000 people15.8 per 100,000 people
August 202534.5 per 100,000 people28.9 per 100,000 people4.6 per 100,000 people11.7 per 100,000 people15.5 per 100,000 people15.6 per 100,000 people
July 202552 per 100,000 people25.8 per 100,000 people4.6 per 100,000 people16.1 per 100,000 people16.1 per 100,000 people16.3 per 100,000 people
June 202536.9 per 100,000 people19.7 per 100,000 people7.7 per 100,000 people11 per 100,000 people14.2 per 100,000 people14.8 per 100,000 people
May 202535.9 per 100,000 people16.6 per 100,000 people7.7 per 100,000 people10.2 per 100,000 people13.4 per 100,000 people14.7 per 100,000 people
April 202528.8 per 100,000 people15.8 per 100,000 people6.9 per 100,000 people9.5 per 100,000 people11.9 per 100,000 people13.5 per 100,000 people
March 202529.8 per 100,000 people14.3 per 100,000 people5.4 per 100,000 people7.3 per 100,000 people11.1 per 100,000 people13.1 per 100,000 people
February 202525.5 per 100,000 people12.3 per 100,000 people9.2 per 100,000 people8 per 100,000 people10.3 per 100,000 people11.9 per 100,000 people
January 202518.4 per 100,000 people12.7 per 100,000 people9.2 per 100,000 people8 per 100,000 people11.4 per 100,000 people13 per 100,000 people
December 202422.5 per 100,000 people9.6 per 100,000 people3.1 per 100,000 people5.2 per 100,000 people11.4 per 100,000 people12.8 per 100,000 people
November 202429.6 per 100,000 people14.6 per 100,000 people7.7 per 100,000 people7.4 per 100,000 people14.9 per 100,000 people15.8 per 100,000 people
October 202425.8 per 100,000 people17.3 per 100,000 people14.7 per 100,000 people7.4 per 100,000 people14.7 per 100,000 people15.2 per 100,000 people
September 202428.6 per 100,000 people17.3 per 100,000 people13.9 per 100,000 people7.4 per 100,000 people15 per 100,000 people15.3 per 100,000 people
August 202421.6 per 100,000 people23 per 100,000 people9.3 per 100,000 people8.1 per 100,000 people14.9 per 100,000 people15.4 per 100,000 people
July 202427.7 per 100,000 people31.1 per 100,000 people7 per 100,000 people11.8 per 100,000 people15.7 per 100,000 people15.9 per 100,000 people
June 202428.6 per 100,000 people51.8 per 100,000 people10.1 per 100,000 people9.6 per 100,000 people14.2 per 100,000 people14.2 per 100,000 people
May 202420.2 per 100,000 people34.5 per 100,000 people15.5 per 100,000 people8.1 per 100,000 people13.5 per 100,000 people14.1 per 100,000 people
April 202418.8 per 100,000 people43 per 100,000 people10.1 per 100,000 people5.9 per 100,000 people13.3 per 100,000 people13.6 per 100,000 people
March 202416.9 per 100,000 people33.8 per 100,000 people7.7 per 100,000 people5.2 per 100,000 people11.7 per 100,000 people12.6 per 100,000 people
February 202420.7 per 100,000 people38 per 100,000 people9.3 per 100,000 people5.2 per 100,000 people12 per 100,000 people12 per 100,000 people
January 202423 per 100,000 people24.6 per 100,000 people6.2 per 100,000 people2.2 per 100,000 people11.6 per 100,000 people12.7 per 100,000 people
December 202326.2 per 100,000 people30.9 per 100,000 people6.2 per 100,000 people5.3 per 100,000 people11.4 per 100,000 people12.2 per 100,000 people
November 202330.4 per 100,000 people30.9 per 100,000 people9.4 per 100,000 people6 per 100,000 people13.9 per 100,000 people15 per 100,000 people
October 202332.7 per 100,000 people29.4 per 100,000 people10.1 per 100,000 people6 per 100,000 people13.8 per 100,000 people14.6 per 100,000 people
September 202334.6 per 100,000 people22 per 100,000 people8.6 per 100,000 people9.8 per 100,000 people14.2 per 100,000 people14.6 per 100,000 people
August 202336.5 per 100,000 people36.3 per 100,000 people7.8 per 100,000 people8.3 per 100,000 people13.9 per 100,000 people13.7 per 100,000 people
July 202332.3 per 100,000 people27.8 per 100,000 people10.1 per 100,000 people4.5 per 100,000 people13.3 per 100,000 people12.8 per 100,000 people
June 202326.2 per 100,000 people32.9 per 100,000 people10.1 per 100,000 people5.3 per 100,000 people12.7 per 100,000 people12.5 per 100,000 people
May 202319.6 per 100,000 people40.6 per 100,000 people7 per 100,000 people4.5 per 100,000 people11.2 per 100,000 people11.4 per 100,000 people
April 202322 per 100,000 people31.7 per 100,000 people7 per 100,000 people7.5 per 100,000 people9.3 per 100,000 people9.7 per 100,000 people
March 202327.6 per 100,000 people48.7 per 100,000 people7.8 per 100,000 people5.3 per 100,000 people11.2 per 100,000 people10.8 per 100,000 people
February 202316.8 per 100,000 people44.1 per 100,000 people6.2 per 100,000 people3.8 per 100,000 people10.2 per 100,000 people9.2 per 100,000 people
January 202310.8 per 100,000 people31.7 per 100,000 people14 per 100,000 people5.3 per 100,000 people10 per 100,000 people9.6 per 100,000 people
December 202221 per 100,000 people30.8 per 100,000 people4 per 100,000 people6.1 per 100,000 people10.2 per 100,000 people10.5 per 100,000 people
November 202227.7 per 100,000 people34 per 100,000 people9.5 per 100,000 people5.4 per 100,000 people12.1 per 100,000 people11.8 per 100,000 people
October 202226.7 per 100,000 people37.6 per 100,000 people7.9 per 100,000 people6.1 per 100,000 people12.3 per 100,000 people11.2 per 100,000 people
September 202228.6 per 100,000 people28.9 per 100,000 people7.1 per 100,000 people5.4 per 100,000 people13 per 100,000 people11.6 per 100,000 people
August 202235.3 per 100,000 people30.8 per 100,000 people11.1 per 100,000 people2.3 per 100,000 people12.7 per 100,000 people11.7 per 100,000 people
July 202220 per 100,000 people30.8 per 100,000 people13.5 per 100,000 people3.8 per 100,000 people12.1 per 100,000 people11.1 per 100,000 people
June 202220.5 per 100,000 people28.1 per 100,000 people5.5 per 100,000 people6.9 per 100,000 people10.7 per 100,000 people9.7 per 100,000 people
May 202218.1 per 100,000 people26.9 per 100,000 people3.2 per 100,000 people5.4 per 100,000 people9.9 per 100,000 people9.2 per 100,000 people
April 202217.7 per 100,000 people22.5 per 100,000 people2.4 per 100,000 people3.8 per 100,000 people8.8 per 100,000 people8.1 per 100,000 people
March 202213.4 per 100,000 people24.1 per 100,000 people2.4 per 100,000 people3.8 per 100,000 people8 per 100,000 people8 per 100,000 people
February 202217.2 per 100,000 people22.5 per 100,000 people7.1 per 100,000 people3.1 per 100,000 people7.2 per 100,000 people6.9 per 100,000 people
January 202212.4 per 100,000 people19 per 100,000 people4.7 per 100,000 people0.8 per 100,000 people6.9 per 100,000 people7.2 per 100,000 people
December 202117.9 per 100,000 people35.9 per 100,000 people2.4 per 100,000 people3.1 per 100,000 people8.6 per 100,000 people8.2 per 100,000 people
November 202119.3 per 100,000 people27.5 per 100,000 people8 per 100,000 people4.7 per 100,000 people9.9 per 100,000 people9.8 per 100,000 people
October 202122.7 per 100,000 people18.6 per 100,000 people5.6 per 100,000 people4.7 per 100,000 people9 per 100,000 people9.2 per 100,000 people
September 202120.8 per 100,000 people13.7 per 100,000 people4.8 per 100,000 people3.1 per 100,000 people9.1 per 100,000 people9.3 per 100,000 people
August 202121.2 per 100,000 people12.5 per 100,000 people5.6 per 100,000 people1.6 per 100,000 people8 per 100,000 people8.9 per 100,000 people
July 202115.9 per 100,000 people17 per 100,000 people4.8 per 100,000 people2.3 per 100,000 people8.2 per 100,000 people8.7 per 100,000 people
June 202117.9 per 100,000 people22.6 per 100,000 people4.8 per 100,000 people2.3 per 100,000 people7.9 per 100,000 people8.4 per 100,000 people
May 202115 per 100,000 people11.3 per 100,000 people3.2 per 100,000 people2.3 per 100,000 people6.3 per 100,000 people7.5 per 100,000 people
April 202115 per 100,000 people9.3 per 100,000 people2.4 per 100,000 people1.6 per 100,000 people5.6 per 100,000 people6.9 per 100,000 people
March 202115.9 per 100,000 people8.5 per 100,000 people5.6 per 100,000 people2.3 per 100,000 people5.5 per 100,000 people7 per 100,000 people
February 202112.1 per 100,000 people22.6 per 100,000 people5.6 per 100,000 people2.3 per 100,000 people6.3 per 100,000 people7 per 100,000 people
January 202120.8 per 100,000 people27.1 per 100,000 people7.2 per 100,000 people3.1 per 100,000 people6.9 per 100,000 people7.8 per 100,000 people
December 202020.1 per 100,000 people28.6 per 100,000 people3.3 per 100,000 people6.4 per 100,000 people8.5 per 100,000 people8.4 per 100,000 people
November 202022.5 per 100,000 people32.2 per 100,000 people6.5 per 100,000 people8 per 100,000 people9.8 per 100,000 people9.5 per 100,000 people
October 202020.6 per 100,000 people27.7 per 100,000 people10.6 per 100,000 people5.6 per 100,000 people8.5 per 100,000 people8.3 per 100,000 people

Definition: Estimated number of different people seen sleeping rough at any point during the calendar month, based on outreach contacts reported by each council, per 100,000 residents (Rough Sleeping Data Framework Table 2, rate printed by MHCLG using the latest ONS population estimates). Same definition of rough sleeping as the autumn snapshot, but counted over a whole month.

  • This is unverified management information, not official statistics. Councils can correct it later.
  • A monthly count is higher than the single-night snapshot because it includes everyone seen during the month. Do not compare the two directly.
  • It depends on how much outreach work is done: more outreach can find more people.

Portsmouth

Households on the council housing register (waiting list)

1,504 households 2025

Down 62% since 1996 (3,952).

Up 57% in the last ten years (from 960 in 2015).

Administrative records

Trend, comparison and definition

What this answers: How many households were on the council's list for social housing at the end of each year?

Households on the council housing register (waiting list)

1996 to 2025

Portsmouth · households

Reviewed figures: 1996 to 2025. The chart opens on the latest 30 years; choose All history for the full reviewed record.

Shown on this chart: From 1996 to 2025, households on the council housing register (waiting list) fell by 61.9% in Portsmouth and rose by 26.2% in England.

Both places compared over 1996 to 2025, using matching published dates.

Compared areas: Portsmouth; England.

Actual values

PortsmouthEngland

Each line joins consecutive published observations for that place. Missing dates remain gaps.

Households on the council housing register (waiting list) · households
PeriodPortsmouthSouthamptonChichesterWinchesterSouth EastEngland
20251,504 households9,668 households2,421 households1,607 households117,590 households1,340,527 households
20241,158 households8,977 households2,092 households1,544 households118,420 households1,330,602 households
20231,124 households7,666 households2,029 households1,579 households118,337 households1,287,707 households
2022887 households7,386 households2,405 households1,286 households116,164 households1,214,724 households
20211,052 households5,250 households1,527 households1,452 households111,701 households1,185,971 households
20201,065 households8,069 households1,226 households1,369 households111,789 households1,137,234 households
20191,373 households9,556 households1,199 households1,309 households114,573 households1,160,261 households
20181,023 households8,351 households1,162 households1,648 households127,921 households1,126,173 households
2017848 households8,296 households1,480 households2,029 households151,342 households1,158,034 households
2016878 households7,001 households1,780 households2,265 households154,904 households1,184,750 households
2015960 households11,573 households1,934 households2,157 households178,050 households1,256,575 households
2014849 households13,287 households3,351 households2,084 households194,349 households1,370,410 households
20131,763 households10,072 households5,837 households2,447 households236,605 households1,687,899 households
20121,841 households12,257 households4,368 households3,094 households234,736 households1,851,884 households
20112,597 households16,258 households4,982 households2,738 households226,181 households1,837,973 households
20102,684 households16,042 households6,946 households2,738 households216,297 households1,759,439 households
20093,320 households15,529 households5,922 households3,157 households206,287 households1,764,056 households
20084,562 households11,662 households3,779 households2,230 households203,851 households1,770,629 households
20076,751 households10,117 households2,678 households2,205 households205,007 households1,671,009 households
20066,661 households11,126 households2,762 households1,607 households192,634 households1,631,235 households
20057,965 households9,225 households2,126 households1,949 households177,432 households1,539,745 households
20048,960 households8,128 households2,280 households1,043 households168,725 households1,436,933 households
20035,525 households6,697 households2,167 households1,237 households146,880 households1,269,325 households
20024,810 households5,811 households2,220 households1,263 households129,234 households1,093,342 households
20014,838 households5,148 households2,187 households1,236 households129,924 households1,039,265 households
20004,389 households4,522 households2,106 households1,138 households115,901 households1,038,720 households
19994,759 households3,699 households2,148 households1,129 households111,425 households1,036,751 households
19984,264 households3,902 households1,940 households1,094 households104,913 households1,020,229 households
19974,504 households2,329 households2,211 households1,013 households102,578 households1,021,664 households
19963,952 households6,233 households1,861 households951 households107,107 households1,062,179 households

Definition: Households on the local authority housing register at 31 March (1 April up to 2017-18; the column year is the year the count was taken), from the Local Authority Housing Statistics return, as published in Live Table 600. Existing council tenants seeking a transfer are excluded; tenants of other social landlords seeking a move are included.

  • Each council sets its own rules on who can join the list (allowed since the Localism Act 2011), and reviews it at different times. So list sizes are not comparable between councils, and a fall can mean stricter rules rather than less need.
  • A list is not the same as the number of households waiting: some may no longer need a home and some may be on more than one council's list.
  • This is a count, not a rate, so councils differ partly because of size and partly because of different qualification rules.

Series breaks: 2003: Choice-based lettings from 2003 were followed by more households joining registers (MHCLG note 4). 2012: The Localism Act 2011 let councils set their own qualification criteria from 2012; many lists shrank (MHCLG note 4).

Portsmouth

Energy certificates for homes rated A to C (lodged that year)

61.9% 2025

1.7 percentage points lower than England (63.6%).

Up 22 percentage points since 2009 (40.1%).

Up 26 percentage points in the last ten years (from 36.4% in 2015).

Administrative records

Trend, comparison and definition

What this answers: Of the homes that got a new energy performance certificate in a year, what share were rated A, B or C?

Energy certificates for homes rated A to C (lodged that year)

2009 to 2025

Portsmouth · %

Reviewed figures: 2009 to 2025.

Shown on this chart: From 2009 to 2025, energy certificates for homes rated A to C (lodged that year) rose by 21.8 percentage points in Portsmouth and rose by 24.3 percentage points in England.

Both places compared over 2009 to 2025, using matching published dates.

Compared areas: Portsmouth; England.

Actual values

PortsmouthEngland

Each line joins consecutive published observations for that place. Missing dates remain gaps.

Energy certificates for homes rated A to C (lodged that year) · % of domestic EPCs lodged
PeriodPortsmouthSouthamptonChichesterWinchesterSouth EastEngland
202561.9%64.9%56.2%67.5%64.4%63.6%
202459.6%60%54.9%67.9%61.5%60.7%
202356.3%59.8%56.5%65.7%60.4%58.9%
202252.2%48.9%58.2%64.3%58.5%55.6%
202150.9%49.5%47.9%62.6%54.4%51.9%
202040.2%48.6%42.5%57%50.3%47.8%
201943.3%43.2%48%58.3%50.7%48%
201836.8%34.2%45.2%56.2%46.5%45.3%
201743.4%47.2%47.8%52.6%46.6%44.3%
201636.4%41.8%36.5%48.6%39.9%36%
201536.4%40.5%39.5%38.5%38%34.5%
201431.8%35.4%32.9%38.7%34.9%31.1%
201323.9%36.8%33.3%41.3%36.1%33%
201238.8%46%38.3%41.9%39.9%38.9%
201139.4%44.4%34.5%39.4%38.3%37.9%
201037.1%44.6%36.2%43.3%39.3%39.3%
200940.1%43.9%34.6%40.6%39.1%39.3%

Definition: Domestic Energy Performance Certificates (EPCs) lodged on the register in the calendar year with an energy efficiency rating of A, B or C, as a percentage of all lodged certificates with a rating A to G (certificates with no recorded rating are left out). Includes new and existing homes. Calculated here by adding the four published quarters of live table D1 for each year; only complete years are shown.

  • This is not all homes. A home only needs an EPC when it is built, sold or let, so the figure describes homes that changed hands or were built that year, not the whole housing stock.
  • New-build homes are almost always rated A to C, so a year or a place with more new building will show a higher share.
  • One home can have more than one certificate. MHCLG realigned the tables to the address-level register data and updated how local authorities are assigned, so earlier published versions of these figures may differ.
  • The rating method does not change when energy prices change.

Portsmouth

Homes empty for more than six months (share of all homes)

1% October 2025

0.18 percentage points lower than England (1.2%), calculated from unrounded figures.

Up 0.21 percentage points since October 2013 (0.8%).

Administrative records

Trend, comparison and definition

What this answers: What share of all homes had been empty and unfurnished for more than six months?

Homes empty for more than six months (share of all homes)

October 2013 to October 2025

Portsmouth · %

Reviewed figures: October 2013 to October 2025.

Shown on this chart: From October 2013 to October 2025, homes empty for more than six months (share of all homes) rose by 0.2 percentage points in Portsmouth and rose by 0.2 percentage points in England.

Both places compared over October 2013 to October 2025, using matching published dates.

Compared areas: Portsmouth; England.

Actual values

PortsmouthEngland

Each line joins consecutive published observations for that place. Missing dates remain gaps.

Homes empty for more than six months (share of all homes) · % of dwellings
PeriodPortsmouthSouthamptonChichesterWinchesterSouth EastEngland
October 20251%1%0.8%0.7%1%1.2%
October 20241%0.9%0.4%0.4%0.9%1%
October 20231%0.8%0.3%0.6%0.8%1%
October 20221.1%0.8%0.3%0.6%0.8%1%
October 20211.3%0.8%0.2%0.6%0.8%1%
October 20201.3%0.8%0.2%0.7%0.9%1.1%
October 20191.1%0.7%0.4%0.6%0.8%0.9%
October 20181%0.7%0.5%0.6%0.7%0.9%
October 20170.5%0.6%0.4%0.6%0.7%0.9%
October 20160.6%0.6%0.5%0.4%0.6%0.8%
October 20150.9%0.6%0.4%0.5%0.6%0.9%
October 20140.7%0.6%0.6%0.7%0.6%0.9%
October 20130.8%0.6%0.7%0.7%0.7%0.9%

Definition: Long-term empty homes recorded for council tax on the count date each autumn (Live Table 615, "All long-term vacants"), divided by the dwelling stock estimate for the same local authority at 31 March of the same calendar year (Live Table 125, unrounded), times 100. The stock date is about six months before the empty-homes count date; this is the nearest published estimate.

  • These counts come from council tax records. They depend on owners telling the council a home is empty, and on the discounts or extra charges each council sets for empty homes, which affect how likely owners are to report it.
  • Dwelling stock for 2022 onwards is provisional and can be revised.
  • From April 2013 councils could set their own empty-home discounts and charge a premium on homes empty for over two years (raised in steps since 2019), which may have changed reporting.

Series breaks: October 2013: April 2013 council tax changes replaced the old empty-property exemptions; earlier years use a different definition and are a separate measure.

Portsmouth

Homes empty for more than six months, older definition (2004 to 2012)

0.8% October 2012

0.31 percentage points lower than England (1.1%), calculated from unrounded figures.

Up 0.09 percentage points since November 2004 (0.7%).

Administrative records

Trend, comparison and definition

What this answers: What share of all homes had been empty and unfurnished for more than six months?

Homes empty for more than six months, older definition (2004 to 2012)

November 2004 to October 2012

Portsmouth · %

Reviewed figures: November 2004 to October 2012.

Shown on this chart: From November 2004 to October 2012, homes empty for more than six months, older definition (2004 to 2012) rose by 0.1 percentage points in Portsmouth and fell by 0.4 percentage points in England.

Both places compared over November 2004 to October 2012, using matching published dates.

Compared areas: Portsmouth; England.

Actual values

PortsmouthEngland

Each line joins consecutive published observations for that place. Missing dates remain gaps.

Homes empty for more than six months, older definition (2004 to 2012) · % of dwellings
PeriodPortsmouthSouthamptonChichesterWinchesterSouth EastEngland
October 20120.8%0.8%1.1%0.8%0.8%1.1%
October 20110.8%0.8%1.2%0.8%0.9%1.2%
October 20101%0.8%1.3%0.7%0.9%1.3%
October 20091.1%0.9%1.2%0.7%1%1.4%
October 20081.2%1%1.3%0.8%1%1.5%
October 20071.1%0.9%1%0.8%1%1.4%
October 20061%1.1%0.9%0.8%1%1.4%
October 20050.8%1%1%0.7%1%1.4%
November 20040.7%0.9%0.8%0.7%1%1.5%

Definition: Long-term empty homes recorded for council tax on the count date each autumn (Live Table 615, "All long-term vacants"), divided by the dwelling stock estimate for the same local authority at 31 March of the same calendar year (Live Table 125, unrounded), times 100. The stock date is about six months before the empty-homes count date; this is the nearest published estimate.

  • These counts come from council tax records. They depend on owners telling the council a home is empty, and on the discounts or extra charges each council sets for empty homes, which affect how likely owners are to report it.
  • Dwelling stock for 2022 onwards is provisional and can be revised.
  • Before April 2013, long-term empty meant unoccupied and substantially unfurnished for over six months; councils could give a 0% to 50% discount. Not directly comparable with 2013 onwards.

Series breaks: October 2012: Last year on the pre-April 2013 definition.

What is being done

Official commitments only, with their status from dated evidence. A completed action is not proof the figures above improved.

  • Approved Portsmouth City Council: Adopt and deliver a five-aim homelessness strategy: prevent homelessness, end rough sleeping, provide the right housing, provide the right support and strengthen joint working, measured by a published suite of measures. evidence 2024-02 ↗
  • Not verified Portsmouth City Council with the Portsmouth City Rough Sleeping and Homelessness Partnership Group: Form a multi-disciplinary prevention hub to provide advice and early intervention. document ↗
  • In progress Portsmouth City Council (Cabinet Member for Housing and Tackling Homelessness): Buy and refurbish at least 200 homes to use as temporary accommodation, held in the Housing Revenue Account, with mid-year and end-of-year progress reports. evidence 2026-03-10 ↗
  • Not verified Portsmouth City Council: Bring forward schemes to increase housing availability, prioritising social and affordable homes and homes for people with additional needs, and reduce the use of temporary accommodation. document ↗
  • Approved Portsmouth City Council: Carry out the Housing Delivery Test action plan to raise housing delivery, led by progressing the emerging Local Plan to adoption, and review the actions every year after each test result. evidence 2025-06 ↗
  • In progress Portsmouth City Council: Complete the Local Plan. evidence 2026-10-21 ↗
  • Proposed Portsmouth City Council (landowner and planning authority): Bring forward a mixed-use City Centre North scheme on the assembled former Tricorn and Sainsbury’s sites (potential for up to 2,300 homes). The scheme itself needs a separate Development Agreement, which depends on viability and has not been approved. evidence 2026-10-17 ↗
  • Proposed Portsmouth City Council: Take forward Tipner West for about 1,000 homes and marine employment space, subject to Local Plan examination, habitats, bridge and funding decisions. evidence 2026-10-17 ↗
  • Approved UK Government (Ministry of Housing, Communities and Local Government), with neighbourhood boards in Landport and Paulsgrove: Fund neighbourhood regeneration in Landport and Paulsgrove through ten-year plans set by resident-led neighbourhood boards. The programme allows up to £20 million per place over ten years. evidence 2026-11-10 ↗
  • Funded Portsmouth City Council (government Rough Sleeping Programme): Run the Rough Sleeping Programme from 2026/27 to 2028/29 with government funding for homes and support for people sleeping rough. evidence 2026-11-04 ↗
  • Funded UK Government (Ministry of Housing, Communities and Local Government): Pay Portsmouth a homelessness, rough sleeping and domestic abuse grant for 2026/27, on condition that the council publishes a homelessness action plan and reports on its use. evidence 2026-05-08 ↗
  • Approved Portsmouth City Council (Cabinet Member for Housing and Tackling Homelessness): Buy a vacant 14-bedroom property on Magdala Road for sheltered housing, giving at least 15 homes including a converted staff unit, let from the housing register. evidence 2026-03-10 ↗
  • Approved Portsmouth City Council (Cabinet Member for Community Safety, Leisure and Sport): Apply an updated Private Sector Housing Enforcement Policy and Civil Financial Penalty Policy, reflecting the Renters’ Rights Act 2025, to breaches and offences from 1 November 2026. evidence 2026-10-20 ↗
  • In progress Portsmouth City Council (planning authority): Require new homes to be nutrient neutral, so that wastewater from development does not add nitrates to the Solent, using mitigation credits under a section 111 agreement. evidence 2026-11-10 ↗
  • In progress Portsmouth City Council with ECF (a partnership of Homes England’s National Housing Bank, L&G and Muse): Work with ECF under the signed Development and Masterplanning Services Agreement on masterplanning, viability testing and a development business case, before any Development Agreement. evidence 2026-08-10 ↗
  • In progress UK Government (Ministry of Housing, Communities and Local Government), with councils and developers: Let first-time buyers in England buy eligible homes for 30% to 50% below market value, with household income up to £80,000 and a price cap of £250,000 after the discount outside London; councils may set local criteria for the first three months of sale. evidence 2024-10-17 ↗
  • In progress Portsmouth City Council (Portsmouth Homes leasehold services), under the UK Government scheme: Let eligible council tenants buy their Portsmouth Homes property at a discount, after at least three years as a public sector tenant (or in armed forces accommodation); some homes, such as specialist housing for older or disabled people, are excluded. evidence 2026-11-10 ↗
  • Approved UK Government (Ministry of Housing, Communities and Local Government), with participating developers and lenders: Help first-time buyers buy an eligible new-build home in England with a deposit of at least 2.5%, a repayment mortgage and a government equity loan of 20% of the price, interest free for five years. evidence 2026-11-03 ↗

Trend, commitments and gaps for this issue →

Who can act

See what could change in Portsmouth → · Your councillors and MPs →

Support & Services

What we couldn’t find yet (5)

These figures would help residents but are not published for Portsmouth in a form we can check and refresh automatically.

  • Ward-level homelessness, temporary accommodation or rough sleeping. MHCLG publishes these only for whole local authorities. It could be requested under the Freedom of Information Act: Portsmouth City Council holds H-CLIC case records by address. A Freedom of Information request to the council (https://www.portsmouth.gov.uk/services/council-and-democracy/transparency/freedom-of-information) could ask for counts by ward of last settled address, with small numbers suppressed.
  • Social housing lettings (new lets of council and housing association homes) for Portsmouth. Not built into this file: council-only lettings are in the 618-column LAHS open data CSV (37 MB, variable definitions in the separate LAHS guidance), and all-landlord lettings are in the CORE social housing lettings tables, which use different definitions. Joining them would mix collections. MHCLG "Social housing lettings in England" (CORE) local authority tables, and Local Authority Housing Statistics open data (https://www.gov.uk/government/statistical-data-sets/local-authority-housing-statistics-open-data). Needs a separate, documented fetcher.
  • Median energy efficiency (SAP) score of homes. The live tables give counts by band, not the median score, for local authorities. Certificate-level data, including the numeric score, is on the MHCLG "Get energy performance of buildings data" service (https://get-energy-performance-data.communities.gov.uk/), which needs a GOV.UK One Login account to download bulk data or use the API, with licensing restrictions set out in its guidance. A separate fetcher could compute a median score per year once access is set up.
  • Condition of all homes (non-decent homes, serious hazards, damp and mould) for Portsmouth. The English Housing Survey estimates non-decent homes only for England and regions, not councils. Councils may hold a private-sector stock condition survey or modelled stock model; ask Portsmouth City Council private sector housing. The council's own landlord stock condition data is reported to the Regulator of Social Housing (tenant satisfaction measures).
  • Number of children (rather than households) in temporary accommodation as a time series. Published in table TA1 but not added here, to keep one household-based series; the latest figure is in data/counts/portsmouth.json. MHCLG statutory homelessness detailed local authority tables, table TA1 column "Children in TA".
Sources and method

Comparison places are chosen automatically: the three nearest official cities, and the three most similar cities in the ONS area classification (cities whose council areas have a similar population make-up), plus England. Where a measure is only published for whole counties, cities inside a county are left out rather than replaced by the county.

Figures are fetched by a script from the official source and shown unchanged. Comparisons use the same definition and period for every place. Rates and shares change in percentage points; counts and levels change in per cent. An increase is not automatically good or bad.

All the data in this topic

The retained source collection contains 0 records for this topic, including comparison areas and older releases. Each record keeps its own period and source date. Current findings above may use newer releases; a later page update does not refresh every record.

Browse 0 measures and their sources

Source downloads and methods →