Skip to content
Facts CountEdition: PortsmouthChange place
or browse all wards

Find your area

Portsmouth · Air, water and waste · part of Environment

Air, water and waste in Portsmouth

The short answer

Share of adult deaths linked to fine particle air pollution in Portsmouth: 4.9% (2024), 0.35 percentage points lower than England (5.3%), calculated from unrounded figures; down 4.2 percentage points since 2018 (9.1%).

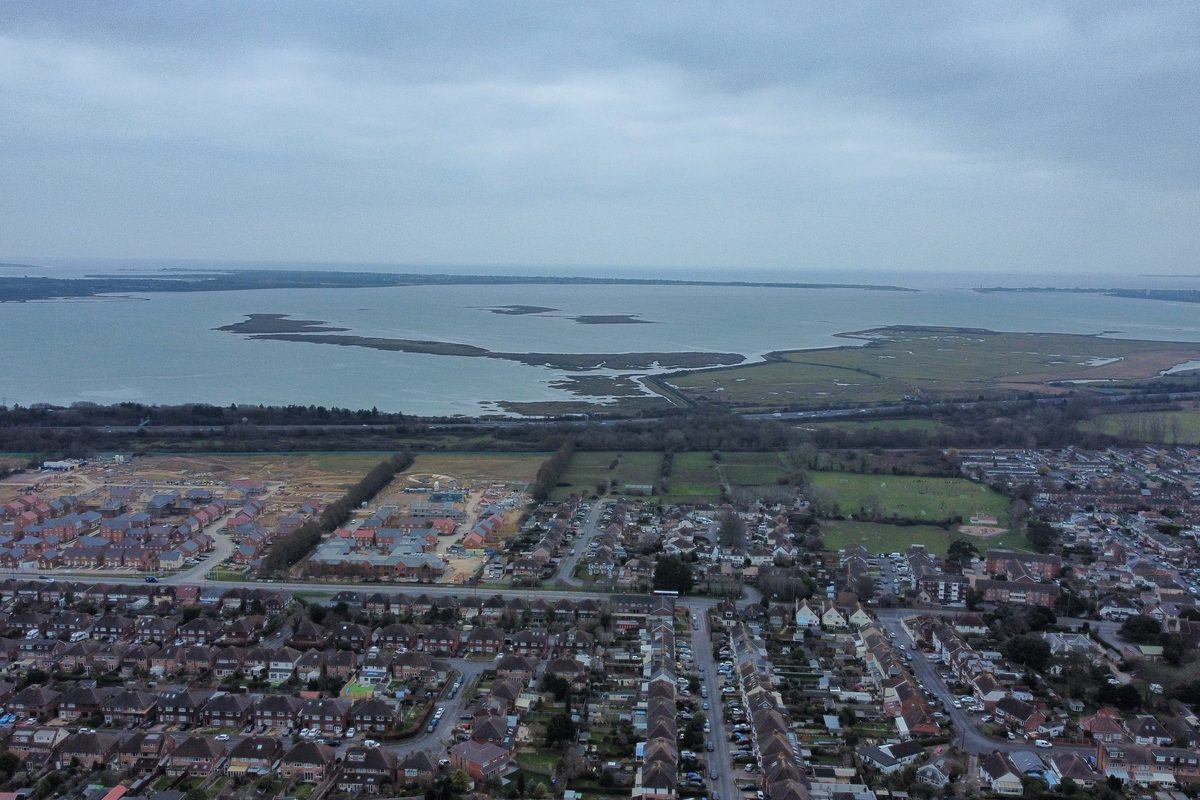
Aerial view over Drayton and Farlington houses towards Farlington Marshes and Langstone Harbour, with North Binness, Long and Baker's islands in the water
Langstone Harbour and Farlington Marshes from the air. Photo: Tim Sheerman-Chase, CC BY 2.0, via Wikimedia Commons

Share of adult deaths linked to fine particle air pollution: how Portsmouth compares

Taking the city's background level of fine particle pollution (PM2.5), what share of deaths among adults aged 30 and over is estimated to be linked to it?

Area covered: Modelled background pollution averaged over where people live in the council area.

Official estimate

Share of adult deaths linked to fine particle air pollution

2018 to 2024

Portsmouth · %

Reviewed figures: 2018 to 2024.

Shown on this chart: From 2018 to 2024, share of adult deaths linked to fine particle air pollution fell by 4.2 percentage points in Portsmouth and fell by 1.8 percentage points in England.

Both places compared over 2018 to 2024, using matching published dates.

Compared areas: Portsmouth; England.

Actual values

PortsmouthEngland

Each line joins consecutive published observations for that place. Missing dates remain gaps.

See the full comparison data
Share of adult deaths linked to fine particle air pollution · % of deaths at ages 30+
PeriodPortsmouthSouthamptonChichesterWinchesterSouth EastEngland
20244.9%4.9%4.5%4.6%5.1%5.3%
20235.2%5%4.5%4.6%5.1%5.2%
20226.2%6.1%4.8%5.6%5.7%5.8%
20216.2%5.9%5%5.3%5.4%5.5%
20206.9%6.3%5.4%5.6%6%5.6%
20197.8%6.9%6.3%5.9%7.2%7.1%
20189.1%8.3%7%7.1%7.7%7.1%

Definition: An estimate, not a count of deaths: the share of annual deaths from all causes in people aged 30 and over that is attributable to long-term exposure to fine particulate matter (PM2.5), worked out from modelled background PM2.5 averaged over where people live and a fixed risk factor (COMEAP 2022: 8% more deaths per 10 micrograms per cubic metre).

  • There are no confidence intervals, so OHID says it is not possible to judge whether a council's figure is really different from England's.
  • Year-to-year changes mostly reflect the weather, and the pollution modelling is updated over time; OHID warns against over-reading trends.
  • 2020 includes the COVID-19 pandemic; OHID says figures for that year should be read with caution.
  • This is background pollution: it does not describe air at the roadside, where nitrogen dioxide is usually the bigger local issue.

What the numbers do and don’t tell you

More monitoring means more recorded spills

The Environment Agency says every storm overflow in England had a monitor fitted by the end of 2023. Earlier years cover fewer overflows, so part of any rise up to 2023 reflects better monitoring rather than more discharges. Rainfall is the main driver of spills, because surface water from roofs and roads shares the same combined sewers.

Fewer spills in 2025, in a drier year

Spills across England fell sharply in 2025. The Environment Agency notes the figures are heavily influenced by rainfall and that 2025 was significantly drier than 2024 across large parts of England, so a fall in one year is not on its own evidence of lasting improvement.

What a 'spill' is

The figures count how many times an overflow was measured discharging and for how long. Long continuous discharges are split into 12 and 24 hour blocks, so a spill lasting several days counts as several spills. The returns do not give volumes or sewage concentrations, so a spill count is not a measure of harm to the sea or to swimmers.

4 more notes, including long-run changes

Southsea East bathing water: Poor in 2025

Environment Agency classification for Southsea East bathing water, by year: 2015 Good; 2016 Excellent; 2017 Excellent; 2018 Excellent; 2019 Excellent; 2021 Good; 2022 Sufficient; 2023 Poor; 2024 Poor; 2025 Poor. No classification was published for 2020. The 2025 classification of Poor is based on samples taken between 2022-05-03 and 2025-09-16, so it reflects several summers, not one. Classes run Excellent, Good, Sufficient, Poor; Poor is the lowest class, below the minimum standard.

Eastney bathing water: Good in 2025

Environment Agency classification for Eastney bathing water, by year: 2015 Excellent; 2016 Excellent; 2017 Excellent; 2018 Excellent; 2019 Excellent; 2021 Excellent; 2022 Excellent; 2023 Good; 2024 Good; 2025 Good. No classification was published for 2020. The 2025 classification of Good is based on samples taken between 2022-05-03 and 2025-09-16, so it reflects several summers, not one. Classes run Excellent, Good, Sufficient, Poor; Poor is the lowest class, below the minimum standard.

Air pollution estimates cannot rank places

OHID's estimate of deaths linked to fine particles has no margin of error, so it says it is not possible to compare a council's figure with England's. It also warns that changes from year to year are driven mostly by the weather rather than by local action.

Fly-tipping numbers depend on how councils count

Defra collects fly-tipping figures from each council and, since 2019/20, asks whether the council counts every incident or only those reported by the public. Portsmouth and Southampton both report 'all incidents', yet Southampton records about 47 per 1,000 people against Portsmouth's 4 in 2024/25. Differences that large can come from how actively street teams log what they clear, not only from how much is dumped.

More measures

Southern Water storm overflows whose discharge outlet (EA grid reference) lies at or near Portsmouth: Portsea Island, the mainland city, the eastern side of Portsmouth Harbour, western Langstone Harbour and the Eastney long sea outfall (box: easting 462,500 to 470,000, northing 92,500 to 107,000). Includes the Budds Farm treatment works storm outfall, which is in Havant but discharges through the Eastney outfall. Excludes Gosport, Fareham, Havant town, Hayling Island and the Isle of Wight.

Sewer storm overflow spills at or near Portsmouth

329 counted spills 2025

Down 7% since 2020 (353).

Administrative records

Trend, comparison and definition

What this answers: How many times did storm overflows that discharge at or near Portsmouth release water from the sewers in each year?

Sewer storm overflow spills at or near Portsmouth

2020 to 2025

Overflows at or near Portsmouth · counted spills

Reviewed figures: 2020 to 2025.

Shown on this chart: From 2020 to 2025, sewer storm overflow spills at or near Portsmouth fell by 6.8% in Overflows at or near Portsmouth and fell by 27.6% in England.

Both places compared over 2020 to 2025, using matching published dates.

Compared areas: Overflows at or near Portsmouth; All water and sewerage companies' storm overflows in England (EA long-term trends table)..

Actual values

Overflows at or near PortsmouthEngland

Each line joins consecutive published observations for that place. Missing dates remain gaps.

Sewer storm overflow spills at or near Portsmouth · counted spills
PeriodOverflows at or near PortsmouthSouthern Water (all overflows)England (all companies)
2025329 counted spills15,554 counted spills292,119 counted spills
2024459 counted spills29,355 counted spills450,398 counted spills
2023462 counted spills29,494 counted spills464,056 counted spills
2022394 counted spills16,688 counted spills301,091 counted spills
2021371 counted spills19,077 counted spills372,533 counted spills
2020353 counted spills19,782 counted spills403,375 counted spills

Definition: Number of spills recorded by event duration monitors on storm overflows, counted with the EA's 12-24 hour method, as reported by water companies to the Environment Agency for each calendar year. Southern Water storm overflows whose discharge outlet (EA grid reference) lies at or near Portsmouth: Portsea Island, the mainland city, the eastern side of Portsmouth Harbour, western Langstone Harbour and the Eastney long sea outfall (box: easting 462,500 to 470,000, northing 92,500 to 107,000). Includes the Budds Farm treatment works storm outfall, which is in Havant but discharges through the Eastney outfall. Excludes Gosport, Fareham, Havant town, Hayling Island and the Isle of Wight.

  • A spill count shows how often an overflow discharged, not how much sewage was released or what harm it caused.
  • Spills are counted with the EA's 12-24 hour method: a long continuous discharge over several days counts as more than one spill, and short discharges close together count as one.
  • Rainfall drives most spills, so wet years have more. The EA says 2025 was much drier than 2024 across large parts of England.
  • Emergency overflows (listed in Southern Water's 2020 file only) are left out so that every year covers storm overflows alone.
  • Monitoring grew over these years (100% of storm overflows in England had monitors by the end of 2023), so earlier totals can be lower partly because fewer overflows were monitored.
  • Raw EA files for 2024 and 2025 are over 3 MB and are not kept in this repository; their SHA-256 hashes are recorded in raw/environment-detail/_manifest.json, and every Portsmouth-area row used is in edm-portsmouth-box-extract.csv (sha256 b97114a25ca8e8f5f2261ff6efeab4e90540d2b9cf70ef95f6eba46c96fb2ad9).

Southern Water storm overflows whose discharge outlet (EA grid reference) lies at or near Portsmouth: Portsea Island, the mainland city, the eastern side of Portsmouth Harbour, western Langstone Harbour and the Eastney long sea outfall (box: easting 462,500 to 470,000, northing 92,500 to 107,000). Includes the Budds Farm treatment works storm outfall, which is in Havant but discharges through the Eastney outfall. Excludes Gosport, Fareham, Havant town, Hayling Island and the Isle of Wight.

Hours of sewer storm overflow spills at or near Portsmouth

1,520 hours 2025

Down 44% since 2020 (2,727).

Administrative records

Trend, comparison and definition

What this answers: For how many hours in total did storm overflows at or near Portsmouth discharge in each year?

Hours of sewer storm overflow spills at or near Portsmouth

2020 to 2025

Overflows at or near Portsmouth · hours

Reviewed figures: 2020 to 2025.

Shown on this chart: From 2020 to 2025, hours of sewer storm overflow spills at or near Portsmouth fell by 44.3% in Overflows at or near Portsmouth and fell by 39.4% in England.

Both places compared over 2020 to 2025, using matching published dates.

Compared areas: Overflows at or near Portsmouth; All water and sewerage companies' storm overflows in England (EA long-term trends table)..

Actual values

Overflows at or near PortsmouthEngland

Each line joins consecutive published observations for that place. Missing dates remain gaps.

Hours of sewer storm overflow spills at or near Portsmouth · hours
PeriodOverflows at or near PortsmouthSouthern Water (all overflows)England (all companies)
20251,520 hours114,868 hours1,878,240 hours
20242,651 hours304,537 hours3,614,428 hours
20232,958 hours317,285 hours3,606,170 hours
20221,960 hours146,819 hours1,754,921 hours
20211,939 hours160,984 hours2,667,452 hours
20202,727 hours197,213 hours3,101,150 hours

Definition: Total hours that monitored storm overflows were recorded discharging in the calendar year (before the 12-24 hour counting is applied), as reported to the Environment Agency. Southern Water storm overflows whose discharge outlet (EA grid reference) lies at or near Portsmouth: Portsea Island, the mainland city, the eastern side of Portsmouth Harbour, western Langstone Harbour and the Eastney long sea outfall (box: easting 462,500 to 470,000, northing 92,500 to 107,000). Includes the Budds Farm treatment works storm outfall, which is in Havant but discharges through the Eastney outfall. Excludes Gosport, Fareham, Havant town, Hayling Island and the Isle of Wight.

  • A spill count shows how often an overflow discharged, not how much sewage was released or what harm it caused.
  • Spills are counted with the EA's 12-24 hour method: a long continuous discharge over several days counts as more than one spill, and short discharges close together count as one.
  • Rainfall drives most spills, so wet years have more. The EA says 2025 was much drier than 2024 across large parts of England.
  • Emergency overflows (listed in Southern Water's 2020 file only) are left out so that every year covers storm overflows alone.
  • Monitoring grew over these years (100% of storm overflows in England had monitors by the end of 2023), so earlier totals can be lower partly because fewer overflows were monitored.
  • Raw EA files for 2024 and 2025 are over 3 MB and are not kept in this repository; their SHA-256 hashes are recorded in raw/environment-detail/_manifest.json, and every Portsmouth-area row used is in edm-portsmouth-box-extract.csv (sha256 b97114a25ca8e8f5f2261ff6efeab4e90540d2b9cf70ef95f6eba46c96fb2ad9).

Southern Water, EA permit A00754 (storm overflow); outlet SZ6679093250 into The Solent.

Spills at each storm overflow at or near Portsmouth

86 counted spills 2025

Down 17% since 2020 (104).

Administrative records

Trend, comparison and definition

What this answers: Which storm overflows at or near Portsmouth spilled most often, and how has each changed?

Spills at each storm overflow at or near Portsmouth

2020 to 2025

HENDERSON ROAD EASTNEY CSO · counted spills

Reviewed figures: 2020 to 2025.

Shown on this chart: From 2020 to 2025, spills at each storm overflow at or near Portsmouth fell by 17.3% in HENDERSON ROAD EASTNEY CSO and fell by 38.1% in BUDDS FARM HAVANT SSO.

Both places compared over 2020 to 2025, using matching published dates.

Compared areas: HENDERSON ROAD EASTNEY CSO; Southern Water, EA permit A00751 (settled storm overflow); outlet SZ6679093250 into The Solent/Langstone Harbour..

Actual values

HENDERSON ROAD EASTNEY CSOBUDDS FARM HAVANT SSO

Each line joins consecutive published observations for that place. Missing dates remain gaps.

Spills at each storm overflow at or near Portsmouth · counted spills
PeriodHENDERSON ROAD EASTNEY CSOBUDDS FARM HAVANT SSOGRUNEISON ROAD STORM PS (4 overflows: GLADYS AVENUE PORTSMOUTH CSO, NEWCOMEN ROAD PORTSMOUTH CSO, STAMSHAW ROAD PORTSMOUTH CSO, WINSTANLEY ROAD PORTSMOUTH CSO)PIER ROAD SOUTHSEA CSONORTH END AVENUE PORTSMOUTH CSOCOURT LANE COSHAM SSOMILE END ROAD PORTSMOUTH NO 2 CSOMAINLAND DRAYTON SSOFORT CUMBERLAND ROAD EASTNEY SSOWIDLEY ROAD PORTSMOUTH CSOMILE END ROAD PORTSMOUTH NO 1 CSOST ANDREWS ROAD PORTSMOUTH CSOKIRTLEY CLOSE DRAYTON CSOBURRFIELDS ROAD PORTSMOUTH CSOHOLBROOK ROAD PORTSMOUTH CSO
202586 counted spills52 counted spills43 counted spills43 counted spills31 counted spills22 counted spills18 counted spills11 counted spills9 counted spills5 counted spills4 counted spills3 counted spills2 counted spills0 counted spills0 counted spills
2024124 counted spills94 counted spills69 counted spills30 counted spills49 counted spills19 counted spills21 counted spills15 counted spills13 counted spills7 counted spills7 counted spills5 counted spills6 counted spills0 counted spills0 counted spills
2023139 counted spills85 counted spills63 counted spills21 counted spills57 counted spills17 counted spills10 counted spills23 counted spills24 counted spills10 counted spills1 counted spills2 counted spills10 counted spills0 counted spills0 counted spills
2022102 counted spills52 counted spills56 counted spills42 counted spills46 counted spills18 counted spills12 counted spills22 counted spills12 counted spills11 counted spills4 counted spills4 counted spills12 counted spills1 counted spills0 counted spills
2021104 counted spills64 counted spills34 counted spills35 counted spills30 counted spills14 counted spills23 counted spills15 counted spills10 counted spills17 counted spills15 counted spills2 counted spills6 counted spills2 counted spills0 counted spills
2020104 counted spills84 counted spills–59 counted spills11 counted spills5 counted spills6 counted spills16 counted spills3 counted spills19 counted spills18 counted spills22 counted spills6 counted spills––

Definition: Spills counted with the EA's 12-24 hour method at each storm overflow in the area, one series per overflow, named as in the latest Southern Water return. Notes give the hours of discharge and how much of the year the monitor was working. Southern Water storm overflows whose discharge outlet (EA grid reference) lies at or near Portsmouth: Portsea Island, the mainland city, the eastern side of Portsmouth Harbour, western Langstone Harbour and the Eastney long sea outfall (box: easting 462,500 to 470,000, northing 92,500 to 107,000). Includes the Budds Farm treatment works storm outfall, which is in Havant but discharges through the Eastney outfall. Excludes Gosport, Fareham, Havant town, Hayling Island and the Isle of Wight.

  • A spill count shows how often an overflow discharged, not how much sewage was released or what harm it caused.
  • Spills are counted with the EA's 12-24 hour method: a long continuous discharge over several days counts as more than one spill, and short discharges close together count as one.
  • Rainfall drives most spills, so wet years have more. The EA says 2025 was much drier than 2024 across large parts of England.
  • Several overflows can share one outfall pipe; each is reported separately, so the same discharge point can appear more than once.
  • A monitor working less than 90% of the year can miss spills.

Portsmouth City Council as waste collection and disposal authority (unitary).

Household waste recycled, composted or reused

27.5% 2024/25

15 percentage points lower than England (42%), calculated from unrounded figures.

Up 3.1 percentage points since 2010/11 (24.4%).

Official statistics

Trend, comparison and definition

What this answers: What share of household waste is sent for reuse, recycling or composting?

Household waste recycled, composted or reused

2010/11 to 2024/25

Portsmouth · %

Reviewed figures: 2010/11 to 2024/25.

Shown on this chart: From 2010/11 to 2024/25, household waste recycled, composted or reused rose by 3.1 percentage points in Portsmouth and rose by 0.5 percentage points in England.

Both places compared over 2010/11 to 2024/25, using matching published dates.

Compared areas: Portsmouth; England.

Actual values

PortsmouthEngland

Each line joins consecutive published observations for that place. Missing dates remain gaps.

Household waste recycled, composted or reused · % of household waste
PeriodPortsmouthSouthamptonChichesterWinchesterSouth EastEngland
2024/2527.5%29.2%43.2%40.4%45.7%42%
2023/2427.9%29.6%46.4%40.5%46.2%42.3%
2022/2327.7%27.4%45.7%39.5%45.4%41.7%
2021/2227.1%27.7%47%40.6%46.4%42.5%
2020/2124.7%27.5%44.5%40.5%46.1%42.3%
2019/2026.7%29.3%44.9%38.1%47.6%43.8%
2018/1925.5%29.3%46.5%36.1%47.2%43.5%
2017/1824.8%29.5%44.6%36.1%46.7%43.2%
2016/1724.7%28.2%41.1%34.2%46.2%43.7%
2015/1623.4%27.2%39.9%34.6%44.5%43%
2014/1522.7%26.1%38.4%35.3%45%43.7%
2013/1422.2%23.5%39.5%34.4%43.7%43.5%
2012/1322.8%23.9%38.5%35.4%43.4%43.2%
2011/1224.3%23.3%38.5%36.6%43.3%43%
2010/1124.4%25.1%39.2%37.4%41.3%41.5%
2009/10––––40%39.7%
2008/09––––38.4%37.6%
2007/08––––36%34.5%
2006/07––––33.1%30.9%
2005/06––––29.2%26.7%
2004/05––––26.1%22.5%
2003/04––––22.8%17.8%
2002/03––––19.6%14.5%
2001/02––––17.7%12.5%
2000/01––––16.4%11.2%

Definition: Household waste sent for reuse, recycling or composting as a share of all household waste (former national indicator NI192), in the financial year April to March. Defra publishes council figures from 2010/11 and England and regional figures from 2000/01.

  • Waste counts as recycled when it is sent for recycling; material later rejected at sorting plants is handled separately by Defra.
  • In 2024/25 Portsmouth sent 66% of the waste it collected to incineration with energy recovery and 3% to landfill (Defra Table 2); incineration is not counted as recycling.
  • Comparisons between councils depend on what each collects (for example whether garden waste is collected free).
  • Chichester, Winchester are waste collection authorities only. Defra counts the household waste recycling centres and waste disposal run by their county council under the county, so their figures are not fully like for like with unitary councils such as Portsmouth that do both.

Portsmouth

Rubbish not recycled, per household

540 kg per household per year 2024/25

Down 122 per household per year since 2010/11 (662).

Official statistics

Trend, comparison and definition

What this answers: How much household waste is left over for disposal (not reused, recycled or composted) for each household?

Rubbish not recycled, per household

2010/11 to 2024/25

Portsmouth · kg per household per year

Reviewed figures: 2010/11 to 2024/25.

Shown on this chart: From 2010/11 to 2024/25, rubbish not recycled, per household fell by 18.5% in Portsmouth and fell by 16.4% in Southampton.

Both places compared over 2010/11 to 2024/25, using matching published dates.

Compared areas: Portsmouth; Southampton.

Actual values

PortsmouthSouthampton

Each line joins consecutive published observations for that place. Missing dates remain gaps.

Rubbish not recycled, per household · kg per household per year
PeriodPortsmouthSouthamptonChichesterWinchester
2024/25540 kg per household per year567 kg per household per year428 kg per household per year440 kg per household per year
2023/24533 kg per household per year564 kg per household per year416 kg per household per year443 kg per household per year
2022/23537 kg per household per year570 kg per household per year411 kg per household per year446 kg per household per year
2021/22568 kg per household per year587 kg per household per year425 kg per household per year462 kg per household per year
2020/21596 kg per household per year587 kg per household per year466 kg per household per year475 kg per household per year
2019/20570 kg per household per year563 kg per household per year418 kg per household per year443 kg per household per year
2018/19591 kg per household per year578 kg per household per year395 kg per household per year452 kg per household per year
2017/18628 kg per household per year596 kg per household per year410 kg per household per year464 kg per household per year
2016/17650 kg per household per year639 kg per household per year436 kg per household per year485 kg per household per year
2015/16676 kg per household per year681 kg per household per year472 kg per household per year477 kg per household per year
2014/15676 kg per household per year683 kg per household per year473 kg per household per year479 kg per household per year
2013/14673 kg per household per year689 kg per household per year435 kg per household per year489 kg per household per year
2012/13662 kg per household per year671 kg per household per year435 kg per household per year480 kg per household per year
2011/12659 kg per household per year653 kg per household per year479 kg per household per year477 kg per household per year
2010/11662 kg per household per year678 kg per household per year476 kg per household per year483 kg per household per year

Definition: Residual household waste per household in kilograms (former national indicator NI191), financial year April to March.

  • England and South East totals are not published on this per-household basis in Defra's tables, so only the cities are compared.
  • Chichester, Winchester are waste collection authorities only. Defra counts the household waste recycling centres and waste disposal run by their county council under the county, so their figures are not fully like for like with unitary councils such as Portsmouth that do both.

Portsmouth

Fly-tipping incidents recorded per 1,000 people

4.4 incidents per 1,000 residents 2024/25

17 per 1,000 residents lower than England (21.5), calculated from unrounded figures.

Down 0.1 per 1,000 residents since 2019/20 (4.5).

  • 937 fly-tipping incidents recorded
  • 1,234 fly-tipping incidents recorded (earlier basis, 2012/13 to 2018/19) (2018/19)

Administrative records

The numbers over time (2)

Fly-tipping incidents recorded

Fly-tipping incidents recorded

2019/20 to 2024/25

Portsmouth · incidents

Reviewed figures: 2019/20 to 2024/25.

Shown on this chart: From 2019/20 to 2024/25, fly-tipping incidents recorded fell by 3.8% in Portsmouth and rose by 28.4% in England.

Both places compared over 2019/20 to 2024/25, using matching published dates.

Compared areas: Portsmouth; England.

Actual values

PortsmouthEngland

Each line joins consecutive published observations for that place. Missing dates remain gaps.

Fly-tipping incidents recorded · incidents
PeriodPortsmouthSouthamptonChichesterWinchesterSouth EastEngland
2024/25937 incidents12,208 incidents816 incidents736 incidents109,015 incidents1,257,863 incidents
2023/241,092 incidents10,948 incidents891 incidents876 incidents102,647 incidents1,152,632 incidents
2022/23751 incidents9,486 incidents844 incidents1,038 incidents100,230 incidents1,084,044 incidents
2021/22525 incidents9,999 incidents1,372 incidents1,732 incidents102,916 incidents1,091,019 incidents
2020/21724 incidents9,980 incidents1,657 incidents2,120 incidents121,283 incidents1,138,347 incidents
2019/20974 incidents11,824 incidents1,011 incidents1,089 incidents90,507 incidents979,728 incidents

Number of fly-tipping incidents recorded by the council in the financial year April to March, on the basis used since 2019/20.

Fly-tipping incidents recorded (earlier basis, 2012/13 to 2018/19)

Fly-tipping incidents recorded (earlier basis, 2012/13 to 2018/19)

2012/13 to 2017/18

Portsmouth · incidents

Reviewed figures: 2012/13 to 2018/19.

Shown on this chart: From 2012/13 to 2017/18, fly-tipping incidents recorded (earlier basis, 2012/13 to 2018/19) rose by 98.9% in Portsmouth and rose by 39.6% in England.

Comparison shortened to 2012/13 to 2017/18, using matching published dates.

Compared areas: Portsmouth; England.

Actual values

PortsmouthEngland

Each line joins consecutive published observations for that place. Missing dates remain gaps.

Fly-tipping incidents recorded (earlier basis, 2012/13 to 2018/19) · incidents
PeriodPortsmouthSouthamptonChichesterWinchesterSouth EastEngland
2018/191,234 incidents11,400 incidents983 incidents770 incidents84,479 incidents–
2017/181,285 incidents11,107 incidents970 incidents784 incidents79,307 incidents997,612 incidents
2016/171,048 incidents10,046 incidents988 incidents808 incidents79,911 incidents1,011,199 incidents
2015/161,099 incidents8,100 incidents618 incidents746 incidents69,315 incidents941,896 incidents
2014/15923 incidents5,569 incidents536 incidents603 incidents74,484 incidents905,604 incidents
2013/141,029 incidents6,203 incidents515 incidents628 incidents70,029 incidents857,655 incidents
2012/13646 incidents7,819 incidents499 incidents614 incidents66,710 incidents714,637 incidents

Number of fly-tipping incidents recorded by the council in each financial year from 2012/13 to 2018/19, before the method change. Do not join to the later series.

Trend, comparison and definition

What this answers: Allowing for population size, how many fly-tipping incidents does the council record each year?

Fly-tipping incidents recorded per 1,000 people

2019/20 to 2024/25

Portsmouth · incidents per 1,000 residents

Reviewed figures: 2019/20 to 2024/25.

Shown on this chart: From 2019/20 to 2024/25, fly-tipping incidents recorded per 1,000 people fell by 2.2% in Portsmouth and rose by 23.6% in England.

Both places compared over 2019/20 to 2024/25, using matching published dates.

Compared areas: Portsmouth; England.

Actual values

PortsmouthEngland

Each line joins consecutive published observations for that place. Missing dates remain gaps.

Fly-tipping incidents recorded per 1,000 people · incidents per 1,000 residents
PeriodPortsmouthSouthamptonChichesterWinchesterSouth EastEngland
2024/254.4 incidents per 1,000 residents47.1 incidents per 1,000 residents6.3 incidents per 1,000 residents5.4 incidents per 1,000 residents11.3 incidents per 1,000 residents21.5 incidents per 1,000 residents
2023/245.1 incidents per 1,000 residents42.5 incidents per 1,000 residents7 incidents per 1,000 residents6.6 incidents per 1,000 residents10.8 incidents per 1,000 residents19.9 incidents per 1,000 residents
2022/233.6 incidents per 1,000 residents37.5 incidents per 1,000 residents6.7 incidents per 1,000 residents8 incidents per 1,000 residents10.7 incidents per 1,000 residents19 incidents per 1,000 residents
2021/222.5 incidents per 1,000 residents40.4 incidents per 1,000 residents11 incidents per 1,000 residents13.5 incidents per 1,000 residents11.1 incidents per 1,000 residents19.3 incidents per 1,000 residents
2020/213.4 incidents per 1,000 residents39.5 incidents per 1,000 residents13.6 incidents per 1,000 residents16.8 incidents per 1,000 residents13.2 incidents per 1,000 residents20.1 incidents per 1,000 residents
2019/204.5 incidents per 1,000 residents46.8 incidents per 1,000 residents8.3 incidents per 1,000 residents8.7 incidents per 1,000 residents9.9 incidents per 1,000 residents17.4 incidents per 1,000 residents

Definition: Fly-tipping incidents recorded by the council in the year April to March, per 1,000 residents (Defra's published rate, using ONS mid-year estimates). Published from 2019/20.

  • These are incidents recorded by councils, not all fly-tipping that happens. Councils record in different ways: Defra asks each one whether it counts all incidents or only those reported by the public.
  • A higher count can mean more fly-tipping, more active recording by street teams, or easier reporting.
  • Fly-tipping cleared by private landowners is not included.

What is being done

Official commitments only, with their status from dated evidence. A completed action is not proof the figures above improved.

  • Approved Portsmouth City Council: Apply a Safe, Clean and Tidy enforcement policy with visible patrols, a fly-tipping fixed-penalty scale from £400 to £1,000, hotspot mapping and review every three years. evidence 2026-07-13 ↗
  • Approved Portsmouth City Council and Hampshire County Council with the other Project Integra authorities: Adopt the joint waste strategy for Hampshire, Portsmouth and Southampton, with twin-stream recycling expected in future; no timetable for the action plan was set when Portsmouth approved it. evidence 2026-09-24 ↗
  • Approved Portsmouth City Council with the other Hampshire minerals and waste planning authorities: Plan for minerals and waste sites to 2040 under the jointly adopted Hampshire Minerals and Waste Plan. This is planning policy for sites, not household recycling collections. evidence 2026-07-30 ↗
  • Not verified Southern Water (regulated programme set by the Environment Agency): Reduce spills from the Pier Road, Southsea storm overflow with sustainable drainage and storage (WINEP action 08SO103210a). document ↗
  • Not verified Southern Water (regulated programme set by the Environment Agency): Reduce spills from the Gladys Avenue, Portsmouth storm overflow with storage, sustainable drainage preferred (WINEP action 08SO103263a). document ↗
  • Not verified Southern Water (regulated programme set by the Environment Agency): Reduce spills from the Henderson Road, Eastney storm overflow with sustainable drainage and storage (WINEP action 08SO103190a). document ↗
  • Not verified Southern Water (regulated programme set by the Environment Agency): Investigate the causes of poor water quality at the Southsea East bathing water (WINEP action 08SO101010a). document ↗
  • In progress Portsmouth City Council (Southsea Coastal Scheme, with the Environment Agency): Build new flood defences along 4.5 km of Southsea seafront, from Old Portsmouth to Eastney, in six frontages. evidence 2026-10-19 ↗
  • In progress Coastal Partners for Portsmouth City Council, funded by the Environment Agency: Complete phase 5, the final phase of the North Portsea Coastal Scheme, at Ports Creek and Hilsea Lines. evidence 2026-10-23 ↗
  • Not verified Portsmouth City Council: Continue to lobby and work with partners to improve air and water quality and city biodiversity. document ↗
  • In progress Portsmouth City Council (Traffic, Environment and Community Safety Scrutiny Panel): Review sewage discharges into the sea around Portsmouth, taking evidence from Southern Water, the Environment Agency, the University of Portsmouth, campaign groups and Cabinet members, and report recommendations. evidence 2026-11-03 ↗
  • Not verified Portsmouth City Council (lead local flood authority): Reduce surface water flood risk in the fourteen hotspot areas identified in the Surface Water Management Plan (September 2025 update). document ↗
  • Not verified Hampshire County Council (responsible authority, with local partners): Set priorities for nature recovery across Hampshire, including Portsmouth and Southampton, out to mean low water. document ↗
  • In progress Portsmouth City Council (planning authority): Require new homes to be nutrient neutral, so that wastewater from development does not add nitrates to the Solent, using mitigation credits under a section 111 agreement. evidence 2026-11-10 ↗
  • Not verified Southern Water (regulated programme set by the Environment Agency): Cut spills from the Budds Farm, Havant storm overflow (permit A00751) into Langstone Harbour to fewer than 10 a year, with sustainable drainage and storage, to protect shellfish waters (WINEP action 08SO103182a). document ↗
  • Not verified Portsmouth City Council: Continue to lobby and work with partners to improve air and water quality and city biodiversity. document ↗
  • Completed Portsmouth International Port (council-owned): Install shore power so ferries and cruise ships can switch off their engines at berth, serving up to three ships at once. evidence 2026-10-17 ↗
  • In progress Portsmouth City Council (operated by Community First): Run the Pompey Link on-demand bus pilot in the Paulsgrove, Port Solent and Cosham zones, funded through the Bus Service Improvement Plan. evidence 2026-10-17 ↗
  • Approved Portsmouth City Council: Deliver a ranked, provisional programme of transport schemes for 2026/27 to 2029/30 under the Transport Implementation Plan, with an outline to 2038. evidence 2026-07 ↗
  • Approved Portsmouth City Council (Full Council): Deliver four schemes added to the 2026/27 capital programme: a raised zebra crossing on Lawrence Road, traffic calming on Highbury Grove, five deployable CCTV cameras for Charles Dickens ward and more accessible play equipment. evidence 2026-02-24 ↗
  • Approved Portsmouth City Council (Full Council): Deliver seven small schemes added to the 2026/27 capital programme, including Anchorage Lodge refurbishment, security shutters at Drayton Park and a one-way feasibility study for Kensington Road and Chelmsford Road. evidence 2026-02-24 ↗
  • In progress Portsmouth City Council and Hampshire County Council (Department for Transport Transforming Cities Fund): Deliver the Portsmouth and South East Hampshire transport package, including bus priority, junction and walking improvements, with £55.6 million from the Department for Transport. evidence 2026-09 ↗
  • In progress Portsmouth City Council with Stagecoach South and First Solent (Enhanced Partnership): Deliver the Bus Service Improvement Plan through the Enhanced Partnership: bus priority and bus-lane surfacing, extra services, enforcement of bus lanes, bus signal priority and upgraded “Super Stop” shelters. evidence 2026-09-17 ↗
  • Approved Portsmouth City Council (Cabinet): Plan how highway maintenance will be provided when the 25-year highways PFI contract ends on 31 March 2030, through a dedicated programme team, with a full options paper (costs and risks) due at Cabinet in spring 2027. evidence 2026-10-27 ↗

Trend, commitments and gaps for this issue →

Who can act

  • Southern Water — Runs Portsmouth's sewers, storm overflows, pumping stations (including Eastney) and the Budds Farm treatment works; must operate overflows within its environmental permits.
  • Environment Agency — Issues and enforces permits for storm overflows, monitors and classifies bathing waters, and investigates pollution incidents.
  • Ofwat — Economic regulator of water companies: sets what Southern Water can charge and spend, and its performance targets.
  • Portsmouth City Council — Collects and disposes of household waste, clears and enforces against fly-tipping, and manages local air quality (Air Quality Management Areas and the Clean Air Zone).
  • Department for Environment, Food & Rural Affairs — Sets national policy and targets on air quality, water quality and waste, and publishes the waste and fly-tipping statistics.

See what could change in Portsmouth → · Your councillors and MPs →

Support & Services

What we couldn’t find yet (6)

These figures would help residents but are not published for Portsmouth in a form we can check and refresh automatically.

  • Storm overflow spills for Southampton on the same basis. This file applies a grid-reference filter around Portsmouth only; a matching Southampton filter has not been built and reviewed. Same Environment Agency EDM annual return files; a reviewed outlet box or list for Southampton Water, the Itchen and the Test would be needed.
  • Storm overflow spill volumes and water quality impact. EDM returns record when and how long overflows discharge, not how much or what it contained. Southern Water holds flow data for some sites; ask Southern Water or the Environment Agency (FOI/EIR request) for flow-monitored overflow volumes.
  • Nitrogen dioxide at Portsmouth monitoring sites. Not fetched in this file; DEFRA UK-AIR site data downloads were not reachable from the fetcher. The site evidence is held in lib/data-registry/portsmouth-transport.ts. DEFRA UK-AIR (https://uk-air.defra.gov.uk/data/) for automatic sites; Portsmouth City Council Air Quality Annual Status Reports for diffusion tubes.
  • PM2.5-attributable mortality before 2018. The older Fingertips indicator (30101) used a different method and is no longer served by the Fingertips data API. OHID Fingertips historical data link on indicator 93861's metadata, or ask OHID (fingertips@dhsc.gov.uk) for the archived series.
  • Residual waste per household for England and the South East. Defra's tables give this indicator for councils only. Defra Waste and Resource Statistics (via WasteDataFlow); could be requested from Defra.
  • Fly-tipping by ward or street. Defra publishes council totals only; the council has not published a recurring ward or street breakdown. It could be requested under the Freedom of Information Act: Freedom of Information request to Portsmouth City Council for fly-tipping incidents recorded in WasteDataFlow by ward, by quarter.
Sources and method

Comparison places are chosen automatically: the three nearest official cities, and the three most similar cities in the ONS area classification (cities whose council areas have a similar population make-up), plus England. Where a measure is only published for whole counties, cities inside a county are left out rather than replaced by the county.

Figures are fetched by a script from the official source and shown unchanged. Comparisons use the same definition and period for every place. Rates and shares change in percentage points; counts and levels change in per cent. An increase is not automatically good or bad.

All the data in this topic

The retained source collection contains 0 records for this topic, including comparison areas and older releases. Each record keeps its own period and source date. Current findings above may use newer releases; a later page update does not refresh every record.

Browse 0 measures and their sources

Source downloads and methods →