Skip to content
Facts CountEdition: PortsmouthChange place
or browse all wards

Find your area

Portsmouth · Safety beyond the street map · part of Crime and safety

Safety beyond the street map in Portsmouth

The short answer

Crimes recorded by the police per 1,000 residents in Portsmouth: 114 per 1,000 residents (2025/26), 31 per 1,000 residents higher than England (83.1), calculated from unrounded figures; down 9.3 per 1,000 residents since 2002/03 (124); up 8.7 per 1,000 residents in the last ten years (from 106 in 2015/16).

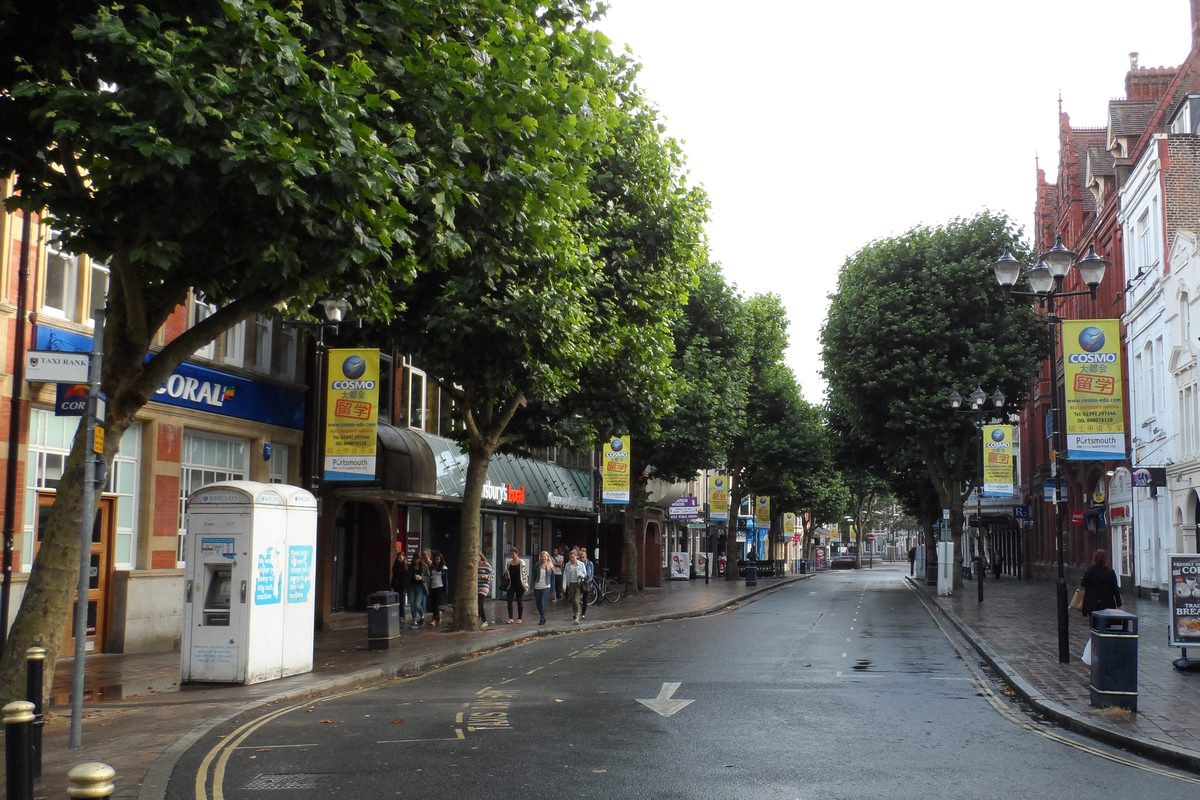
Guildhall Walk in Portsmouth city centre: a tree-lined street with shops, a cash machine and lamp posts, on a grey day
Guildhall Walk, Portsmouth city centre. Photo: Editor5807, CC BY-SA 3.0, via Wikimedia Commons

Crimes recorded by the police per 1,000 residents: how Portsmouth compares

How many crimes do the police record in Portsmouth each year for every 1,000 residents, and how does that compare with Southampton and England?

Area covered: Portsmouth Community Safety Partnership (the Portsmouth City Council area)

Official statistics

Crimes recorded by the police per 1,000 residents

2002/03 to 2025/26

Portsmouth · offences per 1,000 residents

Reviewed figures: 2002/03 to 2025/26.

Shown on this chart: 123.63 offences per 1,000 residents in 2002/03; 114.32 offences per 1,000 residents in 2025/26. These are recorded counts; check the coverage notes before comparing periods.

The line joins consecutive published observations.

See the full comparison data
Crimes recorded by the police per 1,000 residents · offences per 1,000 residents
PeriodPortsmouthSouthamptonChichesterWinchesterSouth EastEngland
2025/26114 offences per 1,000 residents120 offences per 1,000 residents59.8 offences per 1,000 residents55.3 offences per 1,000 residents70.1 offences per 1,000 residents83.1 offences per 1,000 residents
2024/25115 offences per 1,000 residents120 offences per 1,000 residents61.3 offences per 1,000 residents54.3 offences per 1,000 residents72.5 offences per 1,000 residents84.8 offences per 1,000 residents
2023/24118 offences per 1,000 residents126 offences per 1,000 residents63.4 offences per 1,000 residents55.9 offences per 1,000 residents74.6 offences per 1,000 residents87.4 offences per 1,000 residents
2022/23131 offences per 1,000 residents141 offences per 1,000 residents64.7 offences per 1,000 residents69.4 offences per 1,000 residents78.3 offences per 1,000 residents91.6 offences per 1,000 residents
2021/22136 offences per 1,000 residents139 offences per 1,000 residents62.7 offences per 1,000 residents64 offences per 1,000 residents77.4 offences per 1,000 residents88.6 offences per 1,000 residents
2020/21109 offences per 1,000 residents114 offences per 1,000 residents52.5 offences per 1,000 residents49.6 offences per 1,000 residents68.5 offences per 1,000 residents77.2 offences per 1,000 residents
2019/20121 offences per 1,000 residents129 offences per 1,000 residents60.3 offences per 1,000 residents67.6 offences per 1,000 residents79.2 offences per 1,000 residents88.6 offences per 1,000 residents
2018/19122 offences per 1,000 residents127 offences per 1,000 residents57.7 offences per 1,000 residents60.8 offences per 1,000 residents78.2 offences per 1,000 residents88.3 offences per 1,000 residents
2017/18132 offences per 1,000 residents126 offences per 1,000 residents52.3 offences per 1,000 residents57.2 offences per 1,000 residents73.8 offences per 1,000 residents82.6 offences per 1,000 residents
2016/17119 offences per 1,000 residents120 offences per 1,000 residents48 offences per 1,000 residents54.9 offences per 1,000 residents64.1 offences per 1,000 residents73.6 offences per 1,000 residents
2015/16106 offences per 1,000 residents111 offences per 1,000 residents41.7 offences per 1,000 residents53 offences per 1,000 residents59 offences per 1,000 residents66.9 offences per 1,000 residents
2014/1588.8 offences per 1,000 residents96.7 offences per 1,000 residents41.1 offences per 1,000 residents45.2 offences per 1,000 residents54.4 offences per 1,000 residents61.6 offences per 1,000 residents
2013/1481.4 offences per 1,000 residents90 offences per 1,000 residents39.2 offences per 1,000 residents43.1 offences per 1,000 residents53.5 offences per 1,000 residents60.9 offences per 1,000 residents
2012/1388.3 offences per 1,000 residents91 offences per 1,000 residents46.5 offences per 1,000 residents43.9 offences per 1,000 residents54.8 offences per 1,000 residents62.2 offences per 1,000 residents
2011/12105 offences per 1,000 residents111 offences per 1,000 residents50.4 offences per 1,000 residents51.3 offences per 1,000 residents61.1 offences per 1,000 residents69 offences per 1,000 residents
2010/11105 offences per 1,000 residents116 offences per 1,000 residents53.6 offences per 1,000 residents53.5 offences per 1,000 residents65.6 offences per 1,000 residents72.6 offences per 1,000 residents
2009/10114 offences per 1,000 residents123 offences per 1,000 residents55.9 offences per 1,000 residents56.9 offences per 1,000 residents69.4 offences per 1,000 residents76.4 offences per 1,000 residents
2008/09126 offences per 1,000 residents145 offences per 1,000 residents56 offences per 1,000 residents60.1 offences per 1,000 residents75.8 offences per 1,000 residents83.6 offences per 1,000 residents
2007/08127 offences per 1,000 residents153 offences per 1,000 residents61.1 offences per 1,000 residents62.3 offences per 1,000 residents80.4 offences per 1,000 residents89 offences per 1,000 residents
2006/07143 offences per 1,000 residents162 offences per 1,000 residents64 offences per 1,000 residents67.8 offences per 1,000 residents88 offences per 1,000 residents97.9 offences per 1,000 residents
2005/06142 offences per 1,000 residents159 offences per 1,000 residents64.7 offences per 1,000 residents64.3 offences per 1,000 residents86.8 offences per 1,000 residents101 offences per 1,000 residents
2004/05145 offences per 1,000 residents153 offences per 1,000 residents68.4 offences per 1,000 residents62.4 offences per 1,000 residents86.9 offences per 1,000 residents102 offences per 1,000 residents
2003/04142 offences per 1,000 residents161 offences per 1,000 residents63.4 offences per 1,000 residents70 offences per 1,000 residents88.5 offences per 1,000 residents110 offences per 1,000 residents
2002/03124 offences per 1,000 residents129 offences per 1,000 residents60.8 offences per 1,000 residents68.3 offences per 1,000 residents83.4 offences per 1,000 residents109 offences per 1,000 residents

Definition: All notifiable offences recorded by the police in the area in the financial year (April to March), excluding fraud and computer misuse, divided by the ONS mid-year resident population for that year and multiplied by 1,000. Counts are the sum of the four published quarters in the Home Office open data. Population: ONS mid-year population estimates (Nomis dataset NM_2002_1).

  • These are crimes recorded by the police, not all crime. Many crimes are never reported, and a rise can mean better recording or more reporting, not only more crime.
  • Fraud is left out: between April 2011 and March 2013 the recording of fraud moved from local police forces to Action Fraud nationally.
  • Rates for places with a busy city centre, a port, a university or many visitors can look high because offences are divided by the number of residents only.
  • Each city here is one council area and one Community Safety Partnership. The England figure adds up the English police forces; it leaves out British Transport Police.
  • The comparison cities are picked by a fixed rule (the nearest official cities and the most similar by ONS area type), not by hand. Chichester, Winchester are district council areas inside a county; the figure covers the district only.
  • Rates are worked out by this site: offences in the financial year divided by the ONS mid-year population for the June inside that year (mid-2025 for 2025/26). ONS's own published rate uses an older population, so it can differ slightly.

What the numbers do and don’t tell you

Recorded crime is not all crime

Survey-based evidence: Crime Survey for England and Wales (adults aged 16 and over living in households in England and Wales; the latest year is interviews from April 2025 to March 2026, about 31,350 adults). The survey asks people about crimes they experienced, whether or not they told the police, so it is the better guide to long-term trends. It is published for England and Wales as a whole, not for Portsmouth. Between 2002/03 and 2025/26 the survey's estimate of crimes against adults and households (excluding fraud and computer misuse) changed by -65%, from about 12.4 million to 4.3 million. Over the same years crimes recorded by the police in England and Wales (excluding fraud) changed by -10%. The two move differently because recorded crime also reflects how willing people are to report and how carefully the police record.

Better recording pushed recorded crime up

In November 2014 the police inspectorate published an inspection of all 43 forces that found crimes reported to the police were being under-recorded. Forces then tightened their recording. ONS links the large rises in recorded violence since 2015 to that inspection, and says better recording and more victims coming forward have contributed to rises in recorded sexual offences. In Portsmouth, recorded violence against the person went from 4,899 offences in 2014/15 to 9,238 in 2017/18 (+89%). Counting rules for stalking, harassment and controlling behaviour changed in 2018 and again in May 2023, which also moves the totals.

Police domestic abuse figures show reports, not how common abuse is

The domestic abuse figures here are crimes the police have recorded and flagged as domestic abuse-related. Many victims never report to the police. ONS says the Crime Survey's private self-completion questions give a more reliable measure of trends in domestic abuse, but that survey is not published for Portsmouth. From April 2023 most forces switched to software (NDQIS) that flags domestic abuse automatically, which ONS says adds offences, so recent years are not directly comparable with earlier ones.

3 more notes, including long-run changes

Anti-social behaviour is not only a police matter

Police anti-social behaviour figures are incidents, not crimes, and ONS notes that councils and social landlords deal with many reports that never reach the police. In Portsmouth, the city council's community safety team and Portsmouth Homes take reports, and residents can ask for an ASB case review if repeated reports get no response.

Police inspection grades (dated): see the grades table

In its PEEL 2023 to 2025 inspection (report July 2025) the police inspectorate graded Hampshire and Isle of Wight Constabulary in eight areas: 2 good, 6 adequate. The grades table shows each area, the force's earlier inspections and the forces next to it. Grades are categories for the whole force area, not scores, and the inspectorate warns against comparing them across inspection cycles. No newer report for this force was listed up to 4 September 2026.

Portsmouth's own domestic abuse and knife-crime counts come from the council's assessments

The police publish domestic abuse and knife crime only for the whole Hampshire and Isle of Wight force area. For Portsmouth alone, this page uses the annual counts the Safer Portsmouth Partnership prints in its strategic assessments, checked against each report. Incidents and crimes are shown separately and are never added together. 7 of the 30 figures shown are calculated from a change a report states, and are marked as calculated. The 2017/18 count is not stated in the reports checked and is left blank. The knife measure is the council's broad definition (it includes possession) and starts in 2021/22. Records before 2006/07 were held on an earlier police system and cannot be reliably compared. These are police records, not how common abuse or knife carrying is.

Police inspection grades for Hampshire and Isle of Wight Constabulary over time

How has the police inspectorate graded the force that polices Portsmouth in each PEEL inspection cycle?

PEEL 2023–25 (PEEL assessment framework 2023–25; five-step grades)
Area inspectedHampshire and Isle of Wight Constabulary
PEEL 2023–25 · July 2025
Using police powers and treating people fairly and respectfullyadequate
Prevention and deterrenceadequate
Responding to the publicadequate
Investigating crimeadequate
Protecting vulnerable peoplegood
Managing offenders and suspectsadequate
Building, supporting and protecting the workforcegood
Leadership and managementadequate
PEEL 2021/22 (PEEL assessment framework 2021/22; five-step grades)
Area inspectedHampshire and Isle of Wight Constabulary
PEEL 2021/22 · April 2023
Recording crimegood
Treating people fairly and with respectgood
Prevention and deterrencerequires improvement
Responding to the publicrequires improvement
Investigating crimeadequate
Protecting vulnerable peopleadequate
Managing offenders and suspectsadequate
Building and developing its workforcegood
Operating efficientlyadequate
PEEL 2018/19 integrated PEEL assessment (effectiveness, efficiency and legitimacy pillars; four-step grades)
Area inspectedHampshire Constabulary
PEEL 2018/19 · February 2020
Effectivenessgood
Efficiencygood
Legitimacygood
PEEL 2015–2017 annual pillar inspections (one report per pillar each year; four-step grades)
Area inspectedHampshire Constabulary
PEEL 2017 · March 2018
Hampshire Constabulary
PEEL 2017 · November 2017
Hampshire Constabulary
PEEL 2017 · December 2017
Hampshire Constabulary
PEEL 2016 · March 2017
Hampshire Constabulary
PEEL 2016 · November 2016
Hampshire Constabulary
PEEL 2016 · December 2016
Hampshire Constabulary
PEEL 2015 · February 2016
Hampshire Constabulary
PEEL 2015 · February 2016
Effectiveness (overall judgment)good––requires improvement––good–
Efficiency (overall judgment)–good––good–––
Legitimacy (overall judgment)––good––good–good
  • Grades are categories, not scores. They cannot be added up, averaged or turned into an overall rating; the inspectorate gives no overall grade.
  • Each grade judges the whole force area (Hampshire, Portsmouth, Southampton and the Isle of Wight) at the time of the inspection, not Portsmouth alone.
  • The inspectorate says grades cannot be compared directly between PEEL cycles, because the areas inspected, the questions and the grade scale change.
  • Each row keeps the areas and wording of its own inspection framework. Areas with similar names in different cycles were not judged in the same way and are not matched up.
  • Until 2018/19 grades had four steps (outstanding, good, requires improvement, inadequate). From 2021/22 there are five, with 'adequate' added between good and requires improvement.
  • In 2015 to 2017 the inspectorate published a separate report for each pillar (effectiveness, efficiency, legitimacy); each row is one report. In 2017 and 2018/19 some areas were not re-inspected and earlier judgments were carried forward inside the overall pillar grade.
  • The force was called Hampshire Constabulary until 2022; it covered the same area.
  • Not shown because the report files could not be found on the inspectorate's file store: PEEL 2014, and the 2015 efficiency report. They are not estimated.
  • The 2021/22 and 2023–25 reports did not grade serious and organised crime for the force (now inspected regionally). The victim service assessment is not graded.

Police inspection grades for Hampshire and Isle of Wight and the forces next to it

How do the latest inspection grades for the force that polices Portsmouth sit beside those for the police forces that border it?

PEEL 2023–25 (PEEL assessment framework 2023–25; five-step grades)
Area inspectedHampshire and Isle of Wight Constabulary
PEEL 2023–25 · July 2025
Dorset Police
PEEL 2023–25 · April 2025
Surrey Police
PEEL 2023–25 · December 2023
Sussex Police
PEEL 2023–25 · July 2025
Thames Valley Police
PEEL 2023–25 · December 2023
Wiltshire Police
PEEL 2023–25 · August 2024
Using police powers and treating people fairly and respectfullyadequaterequires improvementadequateadequategoodrequires improvement
Prevention and deterrenceadequategoodgoodadequateadequategood
Responding to the publicadequaterequires improvementinadequategoodrequires improvementrequires improvement
Investigating crimeadequaterequires improvementadequaterequires improvementrequires improvementrequires improvement
Protecting vulnerable peoplegoodadequateadequateadequateinadequaterequires improvement
Managing offenders and suspectsadequateadequategoodadequaterequires improvementgood
Building, supporting and protecting the workforcegoodadequate–adequate–adequate
Leadership and managementadequateadequateadequateadequaterequires improvementadequate
Recording crime–goodrequires improvementadequate–adequate
Building and developing its workforce––requires improvement–adequate–
PEEL 2025–27 (PEEL assessment framework 2025–2027; five-step grades)
Area inspectedThames Valley Police
PEEL 2025–27 · July 2026
Leadership and force managementrequires improvement
Attracting, developing and retaining its workforce and creating a diverse and inclusive workplacegood
Using its powers fairly, appropriately and with justificationadequate
Preventing and deterring crime and antisocial behaviour, and reducing vulnerabilitygood
Responding to the publicadequate
Investigating crimerequires improvement
Safeguarding children and adults at risk of harmrequires improvement
Managing fraudadequate
  • Grades are categories, not scores. They cannot be added up, averaged or turned into an overall rating; the inspectorate gives no overall grade.
  • Each grade judges the whole force area (Hampshire, Portsmouth, Southampton and the Isle of Wight) at the time of the inspection, not Portsmouth alone.
  • The inspectorate says grades cannot be compared directly between PEEL cycles, because the areas inspected, the questions and the grade scale change.
  • Forces shown: every police force whose area borders Hampshire and Isle of Wight's (Dorset, Surrey, Sussex, Thames Valley and Wiltshire). Bordering is a geographic rule, not a measure of similarity.
  • The PEEL 2023–25 rows use the same framework, but forces were inspected at different times between 2023 and 2025, so the dates differ.
  • Some 2023–25 reports also graded 'recording crime'; Hampshire and Isle of Wight's and Thames Valley's did not, because crime recording was inspected separately for them. A missing area is not a low grade.
  • Surrey's and Thames Valley's 2023–25 reports grade the workforce as 'building and developing its workforce'; the others use 'building, supporting and protecting the workforce'. Both wordings are kept as published.
  • Thames Valley also has a PEEL 2025–27 report, shown as its own row. The 2025–27 framework has different areas and the inspectorate says its grades cannot be compared with 2023–25 grades.
  • Surrey and Wiltshire have also had PEEL 2025–27 reports (listed in the inspectorate's State of Policing 2025 to 2026), but their files could not be read for this page, so their 2023–25 grades are the latest shown. Sussex and Dorset had no 2025–27 report listed up to 4 September 2026.

More measures

Portsmouth Community Safety Partnership (the Portsmouth City Council area)

Violence against the person recorded by the police per 1,000 residents

45.4 offences per 1,000 residents 2025/26

14 per 1,000 residents higher than England (31.3), calculated from unrounded figures.

Up 30 per 1,000 residents since 2002/03 (15.1).

Up 10 per 1,000 residents in the last ten years (from 35.1 in 2015/16).

Official statistics

Trend, comparison and definition

What this answers: How often do the police record violence against the person in Portsmouth compared with Southampton and England?

Violence against the person recorded by the police per 1,000 residents

2002/03 to 2025/26

Portsmouth · offences per 1,000 residents

Reviewed figures: 2002/03 to 2025/26.

Shown on this chart: From 2002/03 to 2025/26, violence against the person recorded by the police per 1,000 residents rose by 200.1% in Portsmouth and rose by 134.9% in England.

Both places compared over 2002/03 to 2025/26, using matching published dates.

Compared areas: Portsmouth; Sum of the 39 English territorial police forces; excludes British Transport Police.

Actual values

PortsmouthEngland

Each line joins consecutive published observations for that place. Missing dates remain gaps.

Violence against the person recorded by the police per 1,000 residents · offences per 1,000 residents
PeriodPortsmouthSouthamptonChichesterWinchesterSouth EastEngland
2025/2645.4 offences per 1,000 residents45.1 offences per 1,000 residents21.2 offences per 1,000 residents21.1 offences per 1,000 residents27.2 offences per 1,000 residents31.3 offences per 1,000 residents
2024/2547.9 offences per 1,000 residents47.1 offences per 1,000 residents21.6 offences per 1,000 residents20.8 offences per 1,000 residents27.8 offences per 1,000 residents31 offences per 1,000 residents
2023/2448.9 offences per 1,000 residents49.5 offences per 1,000 residents22.7 offences per 1,000 residents21.1 offences per 1,000 residents29.2 offences per 1,000 residents32.6 offences per 1,000 residents
2022/2354.7 offences per 1,000 residents56.7 offences per 1,000 residents21.9 offences per 1,000 residents26.6 offences per 1,000 residents31 offences per 1,000 residents34.7 offences per 1,000 residents
2021/2258.5 offences per 1,000 residents59.1 offences per 1,000 residents21.1 offences per 1,000 residents23.1 offences per 1,000 residents31.8 offences per 1,000 residents34.8 offences per 1,000 residents
2020/2144.3 offences per 1,000 residents44.8 offences per 1,000 residents17.5 offences per 1,000 residents18.7 offences per 1,000 residents27.5 offences per 1,000 residents29.7 offences per 1,000 residents
2019/2047.2 offences per 1,000 residents47.4 offences per 1,000 residents17.9 offences per 1,000 residents21.1 offences per 1,000 residents27.9 offences per 1,000 residents29.4 offences per 1,000 residents
2018/1945.5 offences per 1,000 residents44 offences per 1,000 residents15.1 offences per 1,000 residents18.3 offences per 1,000 residents26.8 offences per 1,000 residents28 offences per 1,000 residents
2017/1843.8 offences per 1,000 residents41 offences per 1,000 residents15.3 offences per 1,000 residents18 offences per 1,000 residents23 offences per 1,000 residents23.6 offences per 1,000 residents
2016/1737.5 offences per 1,000 residents34.4 offences per 1,000 residents11.4 offences per 1,000 residents15.7 offences per 1,000 residents18.2 offences per 1,000 residents19.8 offences per 1,000 residents
2015/1635.1 offences per 1,000 residents33.5 offences per 1,000 residents10.3 offences per 1,000 residents14.9 offences per 1,000 residents16.4 offences per 1,000 residents17.1 offences per 1,000 residents
2014/1523.8 offences per 1,000 residents23.6 offences per 1,000 residents9.3 offences per 1,000 residents9.8 offences per 1,000 residents12.6 offences per 1,000 residents13.4 offences per 1,000 residents
2013/1418.3 offences per 1,000 residents18.8 offences per 1,000 residents7.1 offences per 1,000 residents7.6 offences per 1,000 residents10.3 offences per 1,000 residents11 offences per 1,000 residents
2012/1320.3 offences per 1,000 residents18.8 offences per 1,000 residents6.9 offences per 1,000 residents7.5 offences per 1,000 residents9.7 offences per 1,000 residents10.5 offences per 1,000 residents
2011/1223.6 offences per 1,000 residents22.8 offences per 1,000 residents7.8 offences per 1,000 residents8.3 offences per 1,000 residents10.3 offences per 1,000 residents11.1 offences per 1,000 residents
2010/1121.9 offences per 1,000 residents23.6 offences per 1,000 residents8.5 offences per 1,000 residents9.5 offences per 1,000 residents11.5 offences per 1,000 residents11.9 offences per 1,000 residents
2009/1022.8 offences per 1,000 residents26.1 offences per 1,000 residents8.5 offences per 1,000 residents10.4 offences per 1,000 residents12.4 offences per 1,000 residents12.6 offences per 1,000 residents
2008/0920.6 offences per 1,000 residents28.4 offences per 1,000 residents7.6 offences per 1,000 residents10.7 offences per 1,000 residents12.6 offences per 1,000 residents12.9 offences per 1,000 residents
2007/0822.6 offences per 1,000 residents29.3 offences per 1,000 residents8.6 offences per 1,000 residents10.5 offences per 1,000 residents13.5 offences per 1,000 residents13.7 offences per 1,000 residents
2006/0724.7 offences per 1,000 residents27.6 offences per 1,000 residents8.8 offences per 1,000 residents10.5 offences per 1,000 residents14.2 offences per 1,000 residents15.1 offences per 1,000 residents
2005/0626.1 offences per 1,000 residents25.8 offences per 1,000 residents9 offences per 1,000 residents9.6 offences per 1,000 residents13.5 offences per 1,000 residents15.6 offences per 1,000 residents
2004/0525.8 offences per 1,000 residents24.5 offences per 1,000 residents8.5 offences per 1,000 residents10.2 offences per 1,000 residents13.1 offences per 1,000 residents15.9 offences per 1,000 residents
2003/0423.2 offences per 1,000 residents22.5 offences per 1,000 residents6.7 offences per 1,000 residents9.2 offences per 1,000 residents11.6 offences per 1,000 residents15 offences per 1,000 residents
2002/0315.1 offences per 1,000 residents15.5 offences per 1,000 residents5.9 offences per 1,000 residents7.8 offences per 1,000 residents9.8 offences per 1,000 residents13.3 offences per 1,000 residents

Definition: Offences in the Home Office offence group 'Violence against the person' recorded in the financial year (April to March), divided by the ONS mid-year resident population for that year and multiplied by 1,000. Older years have been reclassified by the Home Office into today's offence groups. Population: ONS mid-year population estimates (Nomis dataset NM_2002_1).

  • These are crimes recorded by the police, not all crime. Many crimes are never reported, and a rise can mean better recording or more reporting, not only more crime.
  • Recorded violence and sexual offences are especially affected by changes in police recording and by more victims coming forward. ONS says trends in these recorded offences should be read with caution.
  • Rates for places with a busy city centre, a port, a university or many visitors can look high because offences are divided by the number of residents only.
  • Each city here is one council area and one Community Safety Partnership. The England figure adds up the English police forces; it leaves out British Transport Police.
  • The comparison cities are picked by a fixed rule (the nearest official cities and the most similar by ONS area type), not by hand. Chichester, Winchester are district council areas inside a county; the figure covers the district only.
  • Rates are worked out by this site: offences in the financial year divided by the ONS mid-year population for the June inside that year (mid-2025 for 2025/26). ONS's own published rate uses an older population, so it can differ slightly.

Series breaks: 2014/15: In November 2014 the police inspectorate (HMIC) reported under-recording of crime by police forces. Forces then improved their recording; ONS links the large rises in recorded violence since 2015 to this, so earlier and later years are not like for like. 2018/19: From 2018 stalking, harassment and controlling behaviour were recorded in addition to other crimes reported at the same time, adding to violence figures. 2023/24: From May 2023 that rule was reversed: police no longer record two crimes when one is a stalking, harassment or controlling behaviour offence. This lowers some counts, such as malicious communications.

Portsmouth Community Safety Partnership (the Portsmouth City Council area)

Sexual offences recorded by the police per 1,000 residents

4.9 offences per 1,000 residents 2025/26

1.5 per 1,000 residents higher than England (3.5), calculated from unrounded figures.

Up 3.4 per 1,000 residents since 2002/03 (1.5).

Up 2.1 per 1,000 residents in the last ten years (from 2.8 in 2015/16).

Official statistics

Trend, comparison and definition

What this answers: How often do the police record sexual offences in Portsmouth compared with Southampton and England?

Sexual offences recorded by the police per 1,000 residents

2002/03 to 2025/26

Portsmouth · offences per 1,000 residents

Reviewed figures: 2002/03 to 2025/26.

Shown on this chart: From 2002/03 to 2025/26, sexual offences recorded by the police per 1,000 residents rose by 220.9% in Portsmouth and rose by 223.4% in England.

Both places compared over 2002/03 to 2025/26, using matching published dates.

Compared areas: Portsmouth; Sum of the 39 English territorial police forces; excludes British Transport Police.

Actual values

PortsmouthEngland

Each line joins consecutive published observations for that place. Missing dates remain gaps.

Sexual offences recorded by the police per 1,000 residents · offences per 1,000 residents
PeriodPortsmouthSouthamptonChichesterWinchesterSouth EastEngland
2025/264.9 offences per 1,000 residents4.9 offences per 1,000 residents2.8 offences per 1,000 residents2.6 offences per 1,000 residents3.1 offences per 1,000 residents3.5 offences per 1,000 residents
2024/255.2 offences per 1,000 residents5.3 offences per 1,000 residents2.4 offences per 1,000 residents2.7 offences per 1,000 residents3.1 offences per 1,000 residents3.4 offences per 1,000 residents
2023/244.4 offences per 1,000 residents5.2 offences per 1,000 residents2.5 offences per 1,000 residents2.5 offences per 1,000 residents2.9 offences per 1,000 residents3.1 offences per 1,000 residents
2022/234.7 offences per 1,000 residents5.3 offences per 1,000 residents2.2 offences per 1,000 residents3 offences per 1,000 residents3 offences per 1,000 residents3.2 offences per 1,000 residents
2021/224.7 offences per 1,000 residents5.4 offences per 1,000 residents2.4 offences per 1,000 residents2.8 offences per 1,000 residents3.1 offences per 1,000 residents3.2 offences per 1,000 residents
2020/214 offences per 1,000 residents3.8 offences per 1,000 residents2.1 offences per 1,000 residents2.1 offences per 1,000 residents2.4 offences per 1,000 residents2.5 offences per 1,000 residents
2019/203.7 offences per 1,000 residents4.4 offences per 1,000 residents2.1 offences per 1,000 residents2.4 offences per 1,000 residents2.7 offences per 1,000 residents2.7 offences per 1,000 residents
2018/193.8 offences per 1,000 residents4.2 offences per 1,000 residents2 offences per 1,000 residents2.6 offences per 1,000 residents2.8 offences per 1,000 residents2.7 offences per 1,000 residents
2017/183.9 offences per 1,000 residents4.1 offences per 1,000 residents1.8 offences per 1,000 residents2.4 offences per 1,000 residents2.6 offences per 1,000 residents2.6 offences per 1,000 residents
2016/173.6 offences per 1,000 residents3.7 offences per 1,000 residents1.3 offences per 1,000 residents2 offences per 1,000 residents2.1 offences per 1,000 residents2.1 offences per 1,000 residents
2015/162.8 offences per 1,000 residents3.5 offences per 1,000 residents1.4 offences per 1,000 residents1.6 offences per 1,000 residents1.8 offences per 1,000 residents1.8 offences per 1,000 residents
2014/152.4 offences per 1,000 residents2.9 offences per 1,000 residents1.2 offences per 1,000 residents1.7 offences per 1,000 residents1.5 offences per 1,000 residents1.5 offences per 1,000 residents
2013/141.4 offences per 1,000 residents1.6 offences per 1,000 residents0.67 offences per 1,000 residents0.57 offences per 1,000 residents1 offences per 1,000 residents1.1 offences per 1,000 residents
2012/131.1 offences per 1,000 residents1.2 offences per 1,000 residents0.78 offences per 1,000 residents0.78 offences per 1,000 residents0.82 offences per 1,000 residents0.94 offences per 1,000 residents
2011/121.5 offences per 1,000 residents1.6 offences per 1,000 residents0.79 offences per 1,000 residents0.64 offences per 1,000 residents0.85 offences per 1,000 residents0.93 offences per 1,000 residents
2010/111.5 offences per 1,000 residents1.7 offences per 1,000 residents0.73 offences per 1,000 residents0.92 offences per 1,000 residents0.91 offences per 1,000 residents0.96 offences per 1,000 residents
2009/101.7 offences per 1,000 residents1.7 offences per 1,000 residents1 offences per 1,000 residents0.72 offences per 1,000 residents0.92 offences per 1,000 residents0.95 offences per 1,000 residents
2008/091.7 offences per 1,000 residents2 offences per 1,000 residents0.61 offences per 1,000 residents0.77 offences per 1,000 residents0.93 offences per 1,000 residents0.91 offences per 1,000 residents
2007/081.9 offences per 1,000 residents2.2 offences per 1,000 residents0.63 offences per 1,000 residents0.8 offences per 1,000 residents0.96 offences per 1,000 residents0.95 offences per 1,000 residents
2006/072.4 offences per 1,000 residents2.1 offences per 1,000 residents0.88 offences per 1,000 residents0.94 offences per 1,000 residents1.1 offences per 1,000 residents1 offences per 1,000 residents
2005/062.4 offences per 1,000 residents2.2 offences per 1,000 residents0.74 offences per 1,000 residents0.95 offences per 1,000 residents1.1 offences per 1,000 residents1.1 offences per 1,000 residents
2004/052.3 offences per 1,000 residents2.3 offences per 1,000 residents0.8 offences per 1,000 residents0.91 offences per 1,000 residents1.1 offences per 1,000 residents1.1 offences per 1,000 residents
2003/042 offences per 1,000 residents2.2 offences per 1,000 residents0.61 offences per 1,000 residents1.1 offences per 1,000 residents1 offences per 1,000 residents1.1 offences per 1,000 residents
2002/031.5 offences per 1,000 residents1.9 offences per 1,000 residents0.64 offences per 1,000 residents0.88 offences per 1,000 residents0.92 offences per 1,000 residents1.1 offences per 1,000 residents

Definition: Offences in the Home Office offence group 'Sexual offences' recorded in the financial year (April to March), divided by the ONS mid-year resident population for that year and multiplied by 1,000. Older years have been reclassified by the Home Office into today's offence groups. Population: ONS mid-year population estimates (Nomis dataset NM_2002_1).

  • These are crimes recorded by the police, not all crime. Many crimes are never reported, and a rise can mean better recording or more reporting, not only more crime.
  • Recorded violence and sexual offences are especially affected by changes in police recording and by more victims coming forward. ONS says trends in these recorded offences should be read with caution.
  • Rates for places with a busy city centre, a port, a university or many visitors can look high because offences are divided by the number of residents only.
  • Each city here is one council area and one Community Safety Partnership. The England figure adds up the English police forces; it leaves out British Transport Police.
  • The comparison cities are picked by a fixed rule (the nearest official cities and the most similar by ONS area type), not by hand. Chichester, Winchester are district council areas inside a county; the figure covers the district only.
  • Rates are worked out by this site: offences in the financial year divided by the ONS mid-year population for the June inside that year (mid-2025 for 2025/26). ONS's own published rate uses an older population, so it can differ slightly.

Series breaks: 2014/15: In November 2014 the police inspectorate (HMIC) reported under-recording of crime by police forces. Forces then improved their recording; ONS links the large rises in recorded violence since 2015 to this, so earlier and later years are not like for like. 2018/19: From 2018 stalking, harassment and controlling behaviour were recorded in addition to other crimes reported at the same time, adding to violence figures. 2023/24: From May 2023 that rule was reversed: police no longer record two crimes when one is a stalking, harassment or controlling behaviour offence. This lowers some counts, such as malicious communications.

Portsmouth Community Safety Partnership (the Portsmouth City Council area)

Theft offences (including burglary, vehicle crime and shoplifting) recorded by the police per 1,000 residents

33.7 offences per 1,000 residents 2025/26

7.5 per 1,000 residents higher than England (26.2).

Down 39 per 1,000 residents since 2002/03 (72.5).

Down 5.3 per 1,000 residents in the last ten years (from 39 in 2015/16).

Official statistics

Trend, comparison and definition

What this answers: How often do the police record theft offences (including burglary, vehicle crime and shoplifting) in Portsmouth compared with Southampton and England?

Theft offences (including burglary, vehicle crime and shoplifting) recorded by the police per 1,000 residents

2002/03 to 2025/26

Portsmouth · offences per 1,000 residents

Reviewed figures: 2002/03 to 2025/26.

Shown on this chart: From 2002/03 to 2025/26, theft offences (including burglary, vehicle crime and shoplifting) recorded by the police per 1,000 residents fell by 53.5% in Portsmouth and fell by 59.5% in England.

Both places compared over 2002/03 to 2025/26, using matching published dates.

Compared areas: Portsmouth; Sum of the 39 English territorial police forces; excludes British Transport Police.

Actual values

PortsmouthEngland

Each line joins consecutive published observations for that place. Missing dates remain gaps.

Theft offences (including burglary, vehicle crime and shoplifting) recorded by the police per 1,000 residents · offences per 1,000 residents
PeriodPortsmouthSouthamptonChichesterWinchesterSouth EastEngland
2025/2633.7 offences per 1,000 residents37.6 offences per 1,000 residents18.4 offences per 1,000 residents15.9 offences per 1,000 residents20.7 offences per 1,000 residents26.2 offences per 1,000 residents
2024/2530.9 offences per 1,000 residents36.8 offences per 1,000 residents21 offences per 1,000 residents16.7 offences per 1,000 residents22.5 offences per 1,000 residents28.6 offences per 1,000 residents
2023/2433.7 offences per 1,000 residents38.3 offences per 1,000 residents21.5 offences per 1,000 residents16.9 offences per 1,000 residents23 offences per 1,000 residents29 offences per 1,000 residents
2022/2333.9 offences per 1,000 residents39.8 offences per 1,000 residents22.8 offences per 1,000 residents20.6 offences per 1,000 residents22.6 offences per 1,000 residents28.5 offences per 1,000 residents
2021/2234.4 offences per 1,000 residents34.6 offences per 1,000 residents21 offences per 1,000 residents19.3 offences per 1,000 residents20 offences per 1,000 residents25.2 offences per 1,000 residents
2020/2128.9 offences per 1,000 residents31.2 offences per 1,000 residents16.7 offences per 1,000 residents13.8 offences per 1,000 residents18.1 offences per 1,000 residents22.1 offences per 1,000 residents
2019/2035.8 offences per 1,000 residents41.9 offences per 1,000 residents24.8 offences per 1,000 residents27.5 offences per 1,000 residents27.3 offences per 1,000 residents32.5 offences per 1,000 residents
2018/1940.4 offences per 1,000 residents43.8 offences per 1,000 residents25.9 offences per 1,000 residents23.7 offences per 1,000 residents27.6 offences per 1,000 residents34.1 offences per 1,000 residents
2017/1849.6 offences per 1,000 residents47.3 offences per 1,000 residents21.9 offences per 1,000 residents21.5 offences per 1,000 residents28.5 offences per 1,000 residents34.3 offences per 1,000 residents
2016/1744.4 offences per 1,000 residents48.3 offences per 1,000 residents22.2 offences per 1,000 residents21 offences per 1,000 residents26.6 offences per 1,000 residents32.2 offences per 1,000 residents
2015/1639 offences per 1,000 residents44.6 offences per 1,000 residents18.8 offences per 1,000 residents20.5 offences per 1,000 residents25 offences per 1,000 residents30.4 offences per 1,000 residents
2014/1537.1 offences per 1,000 residents43.4 offences per 1,000 residents19.1 offences per 1,000 residents19.1 offences per 1,000 residents25.7 offences per 1,000 residents30.3 offences per 1,000 residents
2013/1440.4 offences per 1,000 residents44.2 offences per 1,000 residents20.4 offences per 1,000 residents20.8 offences per 1,000 residents27.7 offences per 1,000 residents32.3 offences per 1,000 residents
2012/1343.1 offences per 1,000 residents43.8 offences per 1,000 residents26.9 offences per 1,000 residents21.2 offences per 1,000 residents29.1 offences per 1,000 residents33.4 offences per 1,000 residents
2011/1253.4 offences per 1,000 residents54.3 offences per 1,000 residents29.2 offences per 1,000 residents26.5 offences per 1,000 residents32.4 offences per 1,000 residents36.8 offences per 1,000 residents
2010/1154.6 offences per 1,000 residents55.4 offences per 1,000 residents29.2 offences per 1,000 residents27.8 offences per 1,000 residents33.7 offences per 1,000 residents37.6 offences per 1,000 residents
2009/1058.8 offences per 1,000 residents54.5 offences per 1,000 residents29.9 offences per 1,000 residents28.4 offences per 1,000 residents34.8 offences per 1,000 residents38.4 offences per 1,000 residents
2008/0967.5 offences per 1,000 residents64.2 offences per 1,000 residents31.4 offences per 1,000 residents29.2 offences per 1,000 residents37.8 offences per 1,000 residents42.1 offences per 1,000 residents
2007/0863.9 offences per 1,000 residents65.6 offences per 1,000 residents31.8 offences per 1,000 residents28.7 offences per 1,000 residents38.9 offences per 1,000 residents44.3 offences per 1,000 residents
2006/0771.1 offences per 1,000 residents73.8 offences per 1,000 residents34.6 offences per 1,000 residents31.5 offences per 1,000 residents43.2 offences per 1,000 residents48.7 offences per 1,000 residents
2005/0670.4 offences per 1,000 residents75.5 offences per 1,000 residents35.1 offences per 1,000 residents32.2 offences per 1,000 residents44 offences per 1,000 residents51 offences per 1,000 residents
2004/0571 offences per 1,000 residents72.8 offences per 1,000 residents37.4 offences per 1,000 residents30.6 offences per 1,000 residents45.1 offences per 1,000 residents53.2 offences per 1,000 residents
2003/0473.6 offences per 1,000 residents81.3 offences per 1,000 residents36.6 offences per 1,000 residents38 offences per 1,000 residents49.2 offences per 1,000 residents61.2 offences per 1,000 residents
2002/0372.5 offences per 1,000 residents72 offences per 1,000 residents37.4 offences per 1,000 residents40.3 offences per 1,000 residents49.6 offences per 1,000 residents64.8 offences per 1,000 residents

Definition: Offences in the Home Office offence group 'Theft offences' recorded in the financial year (April to March), divided by the ONS mid-year resident population for that year and multiplied by 1,000. Older years have been reclassified by the Home Office into today's offence groups. Population: ONS mid-year population estimates (Nomis dataset NM_2002_1).

  • These are crimes recorded by the police, not all crime. Many crimes are never reported, and a rise can mean better recording or more reporting, not only more crime.
  • Shoplifting and other thefts depend partly on how often shops and victims report them.
  • Rates for places with a busy city centre, a port, a university or many visitors can look high because offences are divided by the number of residents only.
  • Each city here is one council area and one Community Safety Partnership. The England figure adds up the English police forces; it leaves out British Transport Police.
  • The comparison cities are picked by a fixed rule (the nearest official cities and the most similar by ONS area type), not by hand. Chichester, Winchester are district council areas inside a county; the figure covers the district only.
  • Rates are worked out by this site: offences in the financial year divided by the ONS mid-year population for the June inside that year (mid-2025 for 2025/26). ONS's own published rate uses an older population, so it can differ slightly.

Series breaks: 2014/15: In November 2014 the police inspectorate (HMIC) reported under-recording of crime by police forces. Forces then improved their recording; ONS links the large rises in recorded violence since 2015 to this, so earlier and later years are not like for like.

Portsmouth Community Safety Partnership (the Portsmouth City Council area)

Criminal damage and arson recorded by the police per 1,000 residents

8.2 offences per 1,000 residents 2025/26

1 per 1,000 residents higher than England (7.1), calculated from unrounded figures.

Down 16 per 1,000 residents since 2002/03 (23.9).

Down 4.8 per 1,000 residents in the last ten years (from 13 in 2015/16).

Official statistics

Trend, comparison and definition

What this answers: How often do the police record criminal damage and arson in Portsmouth compared with Southampton and England?

Criminal damage and arson recorded by the police per 1,000 residents

2002/03 to 2025/26

Portsmouth · offences per 1,000 residents

Reviewed figures: 2002/03 to 2025/26.

Shown on this chart: From 2002/03 to 2025/26, criminal damage and arson recorded by the police per 1,000 residents fell by 65.7% in Portsmouth and fell by 65.8% in England.

Both places compared over 2002/03 to 2025/26, using matching published dates.

Compared areas: Portsmouth; Sum of the 39 English territorial police forces; excludes British Transport Police.

Actual values

PortsmouthEngland

Each line joins consecutive published observations for that place. Missing dates remain gaps.

Criminal damage and arson recorded by the police per 1,000 residents · offences per 1,000 residents
PeriodPortsmouthSouthamptonChichesterWinchesterSouth EastEngland
2025/268.2 offences per 1,000 residents9.3 offences per 1,000 residents6.9 offences per 1,000 residents4.3 offences per 1,000 residents6.4 offences per 1,000 residents7.1 offences per 1,000 residents
2024/258.9 offences per 1,000 residents9.1 offences per 1,000 residents6.3 offences per 1,000 residents4.1 offences per 1,000 residents6.7 offences per 1,000 residents7.3 offences per 1,000 residents
2023/2410 offences per 1,000 residents10.2 offences per 1,000 residents6.7 offences per 1,000 residents4.7 offences per 1,000 residents7.2 offences per 1,000 residents7.9 offences per 1,000 residents
2022/2311.8 offences per 1,000 residents12.4 offences per 1,000 residents6.9 offences per 1,000 residents5.6 offences per 1,000 residents7.9 offences per 1,000 residents8.6 offences per 1,000 residents
2021/2211 offences per 1,000 residents12.1 offences per 1,000 residents6.9 offences per 1,000 residents6.7 offences per 1,000 residents8 offences per 1,000 residents8.8 offences per 1,000 residents
2020/219.7 offences per 1,000 residents11.5 offences per 1,000 residents6.1 offences per 1,000 residents5 offences per 1,000 residents7.6 offences per 1,000 residents7.9 offences per 1,000 residents
2019/2012.6 offences per 1,000 residents13.1 offences per 1,000 residents7 offences per 1,000 residents6.2 offences per 1,000 residents9 offences per 1,000 residents9.3 offences per 1,000 residents
2018/1913.3 offences per 1,000 residents14.2 offences per 1,000 residents7.5 offences per 1,000 residents6.6 offences per 1,000 residents9.2 offences per 1,000 residents9.5 offences per 1,000 residents
2017/1815 offences per 1,000 residents13.6 offences per 1,000 residents6.1 offences per 1,000 residents6.6 offences per 1,000 residents9.4 offences per 1,000 residents9.9 offences per 1,000 residents
2016/1715 offences per 1,000 residents14.7 offences per 1,000 residents6.7 offences per 1,000 residents6.5 offences per 1,000 residents8.9 offences per 1,000 residents9.5 offences per 1,000 residents
2015/1613 offences per 1,000 residents13 offences per 1,000 residents5.8 offences per 1,000 residents6.3 offences per 1,000 residents8.6 offences per 1,000 residents9.2 offences per 1,000 residents
2014/1512.4 offences per 1,000 residents13.4 offences per 1,000 residents6.2 offences per 1,000 residents6.6 offences per 1,000 residents8.2 offences per 1,000 residents8.6 offences per 1,000 residents
2013/1411.3 offences per 1,000 residents13.7 offences per 1,000 residents6.6 offences per 1,000 residents5.9 offences per 1,000 residents8.3 offences per 1,000 residents8.7 offences per 1,000 residents
2012/1313 offences per 1,000 residents15.4 offences per 1,000 residents7.8 offences per 1,000 residents7.2 offences per 1,000 residents8.9 offences per 1,000 residents9.2 offences per 1,000 residents
2011/1215.3 offences per 1,000 residents18.3 offences per 1,000 residents8.1 offences per 1,000 residents9.3 offences per 1,000 residents10.6 offences per 1,000 residents11 offences per 1,000 residents
2010/1116.4 offences per 1,000 residents21.2 offences per 1,000 residents9.7 offences per 1,000 residents9.5 offences per 1,000 residents11.9 offences per 1,000 residents12.3 offences per 1,000 residents
2009/1018.9 offences per 1,000 residents25 offences per 1,000 residents10.9 offences per 1,000 residents11.2 offences per 1,000 residents13.5 offences per 1,000 residents14.3 offences per 1,000 residents
2008/0924 offences per 1,000 residents32.2 offences per 1,000 residents12.1 offences per 1,000 residents13 offences per 1,000 residents16 offences per 1,000 residents16.7 offences per 1,000 residents
2007/0824.6 offences per 1,000 residents36.2 offences per 1,000 residents13.7 offences per 1,000 residents15.2 offences per 1,000 residents17.7 offences per 1,000 residents18.7 offences per 1,000 residents
2006/0731.6 offences per 1,000 residents40.5 offences per 1,000 residents14 offences per 1,000 residents16.9 offences per 1,000 residents20.4 offences per 1,000 residents21.6 offences per 1,000 residents
2005/0628.4 offences per 1,000 residents39.6 offences per 1,000 residents15 offences per 1,000 residents14.3 offences per 1,000 residents19.7 offences per 1,000 residents21.7 offences per 1,000 residents
2004/0530.8 offences per 1,000 residents39.1 offences per 1,000 residents16.9 offences per 1,000 residents13.5 offences per 1,000 residents19.9 offences per 1,000 residents22.1 offences per 1,000 residents
2003/0429.2 offences per 1,000 residents41.1 offences per 1,000 residents15.7 offences per 1,000 residents14.7 offences per 1,000 residents19.8 offences per 1,000 residents22.7 offences per 1,000 residents
2002/0323.9 offences per 1,000 residents28.6 offences per 1,000 residents13 offences per 1,000 residents13.4 offences per 1,000 residents16.9 offences per 1,000 residents20.9 offences per 1,000 residents

Definition: Offences in the Home Office offence group 'Criminal damage and arson' recorded in the financial year (April to March), divided by the ONS mid-year resident population for that year and multiplied by 1,000. Older years have been reclassified by the Home Office into today's offence groups. Population: ONS mid-year population estimates (Nomis dataset NM_2002_1).

  • These are crimes recorded by the police, not all crime. Many crimes are never reported, and a rise can mean better recording or more reporting, not only more crime.
  • Rates for places with a busy city centre, a port, a university or many visitors can look high because offences are divided by the number of residents only.
  • Each city here is one council area and one Community Safety Partnership. The England figure adds up the English police forces; it leaves out British Transport Police.
  • The comparison cities are picked by a fixed rule (the nearest official cities and the most similar by ONS area type), not by hand. Chichester, Winchester are district council areas inside a county; the figure covers the district only.
  • Rates are worked out by this site: offences in the financial year divided by the ONS mid-year population for the June inside that year (mid-2025 for 2025/26). ONS's own published rate uses an older population, so it can differ slightly.

Series breaks: 2014/15: In November 2014 the police inspectorate (HMIC) reported under-recording of crime by police forces. Forces then improved their recording; ONS links the large rises in recorded violence since 2015 to this, so earlier and later years are not like for like.

Police force area, not a city figure: Hampshire and Isle of Wight Constabulary covers Hampshire, Portsmouth, Southampton and the Isle of Wight (2,063,185 people at mid-2025; Portsmouth is about 10% of them). Portsmouth's own figure is not published for this measure.

Serious offences involving a knife or sharp instrument per 100,000 residents (police force area)

48 offences per 100,000 residents 2025/26

32 per 100,000 residents lower than England (79.9), calculated from unrounded figures.

Down 20 per 100,000 residents since 2019/20 (67.7).

Official statistics

Trend, comparison and definition

What this answers: How often do the police record serious offences involving a knife or sharp object in the Hampshire and Isle of Wight force area, compared with England and Wales?

Serious offences involving a knife or sharp instrument per 100,000 residents (police force area)

2019/20 to 2025/26

Hampshire and Isle of Wight Constabulary area · offences per 100,000 residents

Reviewed figures: 2019/20 to 2025/26.

Shown on this chart: From 2019/20 to 2025/26, serious offences involving a knife or sharp instrument per 100,000 residents (police force area) fell by 29.1% in Hampshire and Isle of Wight Constabulary area and fell by 15.6% in England.

Both places compared over 2019/20 to 2025/26, using matching published dates.

Compared areas: Hampshire and Isle of Wight Constabulary area; English police forces.

Actual values

Hampshire and Isle of Wight Constabulary areaEngland

Each line joins consecutive published observations for that place. Missing dates remain gaps.

Serious offences involving a knife or sharp instrument per 100,000 residents (police force area) · offences per 100,000 residents
PeriodHampshire and Isle of Wight Constabulary areaSussex police force areaLancashire police force areaHumberside police force areaEngland and WalesEngland
2025/2648 offences per 100,000 residents50.4 offences per 100,000 residents69.6 offences per 100,000 residents82.9 offences per 100,000 residents78.7 offences per 100,000 residents79.9 offences per 100,000 residents
2024/2548.1 offences per 100,000 residents59.3 offences per 100,000 residents81.7 offences per 100,000 residents80.3 offences per 100,000 residents85.9 offences per 100,000 residents87.3 offences per 100,000 residents
2023/2451.3 offences per 100,000 residents65.9 offences per 100,000 residents79.9 offences per 100,000 residents94 offences per 100,000 residents88.3 offences per 100,000 residents89.6 offences per 100,000 residents
2022/2364 offences per 100,000 residents58.2 offences per 100,000 residents64.8 offences per 100,000 residents84.1 offences per 100,000 residents85.8 offences per 100,000 residents87.1 offences per 100,000 residents
2021/2263.8 offences per 100,000 residents56.4 offences per 100,000 residents66.4 offences per 100,000 residents84.7 offences per 100,000 residents82.4 offences per 100,000 residents83.7 offences per 100,000 residents
2020/2160.6 offences per 100,000 residents56.2 offences per 100,000 residents57.9 offences per 100,000 residents76.3 offences per 100,000 residents75.3 offences per 100,000 residents76 offences per 100,000 residents
2019/2067.7 offences per 100,000 residents67.8 offences per 100,000 residents64.3 offences per 100,000 residents93.3 offences per 100,000 residents93 offences per 100,000 residents94.7 offences per 100,000 residents

Definition: Selected serious offences where a knife or sharp instrument was used to injure, used as a threat or carried with intent: homicide, attempted murder, threats to kill, assault with injury and assault with intent to cause serious harm, robbery, rape and sexual assault. Count for the financial year from ONS Table P6, divided by the ONS mid-year population of the force area (Hampshire, Portsmouth, Southampton and the Isle of Wight added together; for other force areas, the councils ONS Table C4 lists in that force) and multiplied by 100,000. Shown from 2019/20, when forces moved to the NDQIS method. Population: ONS mid-year population estimates (Nomis dataset NM_2002_1).

  • This is a police force figure covering Hampshire, Portsmouth, Southampton and the Isle of Wight together. Knife crime is not published for Portsmouth on its own.
  • Other force areas are shown because a comparison city is in them. Each is a whole police force area, not that city.
  • Winchester, also a comparison city, is in the Hampshire and Isle of Wight force area too, so it has no separate force row.
  • Possession of a knife without using it is not included; it is counted under possession of weapons offences.
  • Counts are small compared with all crime, so single-year changes can be noisy.

Series breaks: 2019/20: Police forces began using the National Data Quality Improvement Service (NDQIS) to identify knife offences from April 2019. ONS says earlier years are not directly comparable, so they are not shown.

Police force area, not a city figure: Hampshire and Isle of Wight Constabulary covers Hampshire, Portsmouth, Southampton and the Isle of Wight (2,063,185 people at mid-2025; Portsmouth is about 10% of them). Portsmouth's own figure is not published for this measure.

Domestic abuse-related crimes recorded by the police per 1,000 residents (police force area)

12.6 crimes per 1,000 residents 2024/25

Down 0.33 per 1,000 residents since 2023/24 (13).

Official statistics

Trend, comparison and definition

What this answers: How many crimes do the police flag as domestic abuse-related for every 1,000 residents in the Hampshire and Isle of Wight force area, compared with the South East and England and Wales?

Domestic abuse-related crimes recorded by the police per 1,000 residents (police force area)

2023/24 to 2024/25

Hampshire and Isle of Wight Constabulary area · crimes per 1,000 residents

Reviewed figures: 2023/24 to 2024/25.

Shown on this chart: 12.95 crimes per 1,000 residents in 2023/24; 12.62 crimes per 1,000 residents in 2024/25. These are recorded counts; check the coverage notes before comparing periods.

The line joins consecutive published observations.

Domestic abuse-related crimes recorded by the police per 1,000 residents (police force area) · crimes per 1,000 residents
PeriodHampshire and Isle of Wight Constabulary areaSussex police force areaLancashire police force areaHumberside police force areaSouth EastEngland and Wales
2024/2512.6 crimes per 1,000 residents10.5 crimes per 1,000 residents15.6 crimes per 1,000 residents16.7 crimes per 1,000 residents11.2 crimes per 1,000 residents13.2 crimes per 1,000 residents
2023/2413 crimes per 1,000 residents10.9 crimes per 1,000 residents15 crimes per 1,000 residents18.4 crimes per 1,000 residents11.9 crimes per 1,000 residents14.1 crimes per 1,000 residents

Definition: Crimes recorded by the police in the year ending March that the police flagged as domestic abuse-related, per 1,000 residents, as published by ONS in the Domestic abuse in England and Wales data tool (worksheet 2). Each year comes from that year's edition. ONS's own rate, not recalculated here.

  • This is a police force figure for Hampshire, Portsmouth, Southampton and the Isle of Wight together. ONS does not publish it for Portsmouth alone.
  • Other force areas are shown because a comparison city is in them. Each is a whole police force area, not that city.
  • Winchester, also a comparison city, is in the Hampshire and Isle of Wight force area too, so it has no separate force row.
  • It counts crimes reported to and flagged by the police. Most domestic abuse is never reported to the police, so this is not a measure of how common abuse is.
  • A higher rate can reflect more victims coming forward or better flagging by police, as well as more abuse.
  • Only two years are shown on this method; earlier years are kept as a separate measure because the method changed in 2023.

Series breaks: 2023/24: From April 2023 forces began using NDQIS software to flag domestic abuse-related crimes, which ONS says adds offences; and from May 2023 the counting rule for stalking, harassment and controlling behaviour changed. ONS advises caution comparing with earlier years.

Police force area, not a city figure: Hampshire and Isle of Wight Constabulary covers Hampshire, Portsmouth, Southampton and the Isle of Wight (2,063,185 people at mid-2025; Portsmouth is about 10% of them). Portsmouth's own figure is not published for this measure.

Domestic abuse-related crimes recorded by the police per 1,000 residents (police force area, 2018/19 to 2022/23, earlier method)

15.3 crimes per 1,000 residents 2022/23

Up 3.9 per 1,000 residents since 2018/19 (11.3).

Official statistics

Trend, comparison and definition

What this answers: How many crimes do the police flag as domestic abuse-related for every 1,000 residents in the Hampshire and Isle of Wight force area, compared with the South East and England and Wales?

Domestic abuse-related crimes recorded by the police per 1,000 residents (police force area, 2018/19 to 2022/23, earlier method)

2018/19 to 2022/23

Hampshire and Isle of Wight Constabulary area · crimes per 1,000 residents

Reviewed figures: 2018/19 to 2022/23.

Shown on this chart: 11.33 crimes per 1,000 residents in 2018/19; 15.26 crimes per 1,000 residents in 2022/23. These are recorded counts; check the coverage notes before comparing periods.

The line joins consecutive published observations.

Domestic abuse-related crimes recorded by the police per 1,000 residents (police force area, 2018/19 to 2022/23, earlier method) · crimes per 1,000 residents
PeriodHampshire and Isle of Wight Constabulary areaSussex police force areaLancashire police force areaHumberside police force areaSouth EastEngland and Wales
2022/2315.3 crimes per 1,000 residents10.5 crimes per 1,000 residents15.2 crimes per 1,000 residents16.6 crimes per 1,000 residents13.1 crimes per 1,000 residents14.9 crimes per 1,000 residents
2021/2215.3 crimes per 1,000 residents11 crimes per 1,000 residents16.8 crimes per 1,000 residents17.4 crimes per 1,000 residents13.6 crimes per 1,000 residents15.3 crimes per 1,000 residents
2020/2112.9 crimes per 1,000 residents11 crimes per 1,000 residents15.1 crimes per 1,000 residents17.2 crimes per 1,000 residents13 crimes per 1,000 residents14.2 crimes per 1,000 residents
2019/2012.2 crimes per 1,000 residents11.1 crimes per 1,000 residents14.2 crimes per 1,000 residents17.5 crimes per 1,000 residents12.5 crimes per 1,000 residents13.4 crimes per 1,000 residents
2018/1911.3 crimes per 1,000 residents10.2 crimes per 1,000 residents14.6 crimes per 1,000 residents17.2 crimes per 1,000 residents11.8 crimes per 1,000 residents12.6 crimes per 1,000 residents

Definition: Crimes recorded by the police in the year ending March that the police flagged as domestic abuse-related, per 1,000 residents, as published by ONS in the Domestic abuse in England and Wales data tool (worksheet 2). Each year comes from that year's edition. ONS's own rate, not recalculated here.

  • This is a police force figure for Hampshire, Portsmouth, Southampton and the Isle of Wight together. ONS does not publish it for Portsmouth alone.
  • Other force areas are shown because a comparison city is in them. Each is a whole police force area, not that city.
  • Winchester, also a comparison city, is in the Hampshire and Isle of Wight force area too, so it has no separate force row.
  • It counts crimes reported to and flagged by the police. Most domestic abuse is never reported to the police, so this is not a measure of how common abuse is.
  • A higher rate can reflect more victims coming forward or better flagging by police, as well as more abuse.
  • This earlier series stops at 2022/23 because the flagging method and a counting rule changed in 2023. Do not join it to the later series.

Series breaks: 2023/24: Series ends: method change (NDQIS flagging from April 2023; conduct-crime counting rule changed May 2023).

Portsmouth only (the city council area), not the Hampshire and Isle of Wight police force area.

Domestic abuse incidents reported to the police in Portsmouth

6,067 incidents 2024/25

Up 40% since 2011/12 (4,340), but recording practice changed over these years, so this is not a measure of how common abuse is.

Administrative records

Trend, comparison and definition

What this answers: How many domestic abuse incidents were reported to the police in Portsmouth each year?

Domestic abuse incidents reported to the police in Portsmouth

2011/12 to 2024/25

Portsmouth · incidents

Reviewed figures: 2011/12 to 2024/25.

Shown on this chart: 4,340 incidents in 2011/12; 6,067 incidents in 2024/25. 39.8% higher between these observations.

1 missing period in the selected range; the line stops at each gap.

Domestic abuse incidents reported to the police in Portsmouth · incidents
PeriodPortsmouth
2025/26–
2024/256,067 incidents
2023/245,696 incidents
2022/236,688 incidents
2021/226,986 incidents calculated
2020/216,113 incidents
2019/205,905 incidents calculated
2018/196,302 incidents calculated
2017/18–
2016/175,564 incidents
2015/165,053 incidents
2014/154,745 incidents
2013/144,250 incidents
2012/134,211 incidents
2011/124,340 incidents

Calculated, not published: the figures marked “calculated” are the figure a report publishes for another year plus or minus the change it states. 2018/19: 6113 - 208 + 397 (S20, S19; S20 PDF page 3; S19 PDF page 20); 2019/20: 6113 - 208 (S20; S20 PDF page 3); 2021/22: 6688 + 298 (S22; S22 PDF page 20).

Shown as – : not available, and not zero. The 2017/18 count is not stated as a figure in the reports checked; the later assessments chart it without labels, and chart points are not read off as counts. 2025/26 is not yet published in a Safer Portsmouth Partnership assessment.

Definition: Domestic abuse incidents reported to Hampshire Constabulary in Portsmouth in the financial year: the force's headline count supplied to the partnership. An incident is a report; not every incident is a crime, and a count of incidents is not a count of victims or of unique people. 2023/24 is stated for victims over 16 only (assessment footnote); the other years' scope is not stated in the same words. The 2024/25 assessment notes headline counts differ from its own analysis of cleaned raw data.

  • These are crimes and incidents the police recorded, not prevalence. Many victims never report. National survey estimates are not published for Portsmouth and are not used here.
  • Counts are annual city totals. No ward, age or relationship breakdown is held in these figures.
  • Years are not interpolated or read from charts. Calculated values depend on the stated change and on the two editions using the same basis.
  • The partnership's assessments are the source; the underlying police extract has been requested (FOI-790-26-4400-02, tracker id police-da-knife) and may differ in definition.
  • Source files S16, S19, S22, S23 were read from the Internet Archive's copy of the same document because the council's site refuses scripted downloads; the file hashes are recorded.
  • Years shown as – are not available; they are not zero. No annual Portsmouth count was recovered for 1996/97 to 2010/11 in the assessments checked. Records before 2006/07 were held on an earlier police system and cannot be reliably compared with later records (Safer Portsmouth Partnership, 2024/25 assessment).

Series breaks: before 2006/07: The force began its current Record Management System in 2006/07. Earlier local records cannot be reliably compared with later ones (2024/25 assessment, PDF page 8). 2014/15: The November 2014 national inspection of crime recording led forces to record more crimes. The 2016/17 assessment says this affected recorded domestic abuse crimes more than incidents (PDF page 58). 2021/22 to 2023/24: The 2024/25 assessment says the falls in these years were at least partly due to changes in recording practice (PDF page 26). From April 2023 many forces flag domestic abuse automatically, which ONS says adds offences.

Portsmouth only (the city council area), not the Hampshire and Isle of Wight police force area.

Domestic abuse crimes recorded by the police in Portsmouth

3,940 crimes 2024/25

Up 157% since 2011/12 (1,531), but better police recording since 2014 is likely to explain part of the rise, so this is not a measure of how common abuse is.

Administrative records

Trend, comparison and definition

What this answers: How many domestic abuse crimes did the police record in Portsmouth each year?

Domestic abuse crimes recorded by the police in Portsmouth

2011/12 to 2024/25

Portsmouth · crimes

Reviewed figures: 2011/12 to 2024/25.

Shown on this chart: 1,531 crimes in 2011/12; 3,940 crimes in 2024/25. These are recorded counts; check the coverage notes before comparing periods.

1 missing period in the selected range; the line stops at each gap.

Domestic abuse crimes recorded by the police in Portsmouth · crimes
PeriodPortsmouth
2025/26–
2024/253,940 crimes
2023/243,882 crimes
2022/234,595 crimes
2021/224,830 crimes calculated
2020/214,036 crimes
2019/203,922 crimes calculated
2018/193,599 crimes calculated
2017/18–
2016/173,146 crimes
2015/162,718 crimes
2014/151,820 crimes
2013/141,411 crimes
2012/131,430 crimes
2011/121,531 crimes

Calculated, not published: the figures marked “calculated” are the figure a report publishes for another year plus or minus the change it states. 2018/19: 4036 - 114 - 323 (S20, S19; S20 PDF page 3; S19 PDF page 20); 2019/20: 4036 - 114 (S20; S20 PDF page 3); 2021/22: 4595 + 235 (S22; S22 PDF page 20).

Shown as – : not available, and not zero. The 2017/18 count is not stated as a figure in the reports checked; the later assessments chart it without labels, and chart points are not read off as counts. 2025/26 is not yet published in a Safer Portsmouth Partnership assessment.

Definition: The part of those incidents the police recorded and flagged as crimes (of all types) in the financial year. Kept separate from incidents; the two are never added. As for incidents. Crime counts are affected by recording changes: the 2016/17 assessment says the November 2014 national inspection of crime recording raised recorded crimes more than incidents, and the 2024/25 assessment attributes part of the 2021/22 to 2023/24 fall to changes in recording practice.

  • These are crimes and incidents the police recorded, not prevalence. Many victims never report. National survey estimates are not published for Portsmouth and are not used here.
  • Counts are annual city totals. No ward, age or relationship breakdown is held in these figures.
  • Years are not interpolated or read from charts. Calculated values depend on the stated change and on the two editions using the same basis.
  • The partnership's assessments are the source; the underlying police extract has been requested (FOI-790-26-4400-02, tracker id police-da-knife) and may differ in definition.
  • Source files S16, S19, S22, S23 were read from the Internet Archive's copy of the same document because the council's site refuses scripted downloads; the file hashes are recorded.
  • Crimes are a subset of incidents and are never added to them. The force-area rate shown elsewhere (domestic-abuse-crimes-rate) is a different measure on a different basis.

Series breaks: before 2006/07: The force began its current Record Management System in 2006/07. Earlier local records cannot be reliably compared with later ones (2024/25 assessment, PDF page 8). 2014/15: The November 2014 national inspection of crime recording led forces to record more crimes. The 2016/17 assessment says this affected recorded domestic abuse crimes more than incidents (PDF page 58). 2021/22 to 2023/24: The 2024/25 assessment says the falls in these years were at least partly due to changes in recording practice (PDF page 26). From April 2023 many forces flag domestic abuse automatically, which ONS says adds offences.

Portsmouth only (the city council area), not the Hampshire and Isle of Wight police force area.

Knife-enabled crimes in Portsmouth (the council's broad local measure)

826 crimes 2024/25

Up 2% since 2021/22 (811), from a calculated first year, over four years only; the highest year was 2023/24.

Administrative records

Trend, comparison and definition

What this answers: How many knife-enabled crimes did the police record in Portsmouth, on the council's broad local definition?

Knife-enabled crimes in Portsmouth (the council's broad local measure)

2021/22 to 2024/25

Portsmouth · crimes

Reviewed figures: 2021/22 to 2024/25.

Shown on this chart: 811 crimes in 2021/22; 826 crimes in 2024/25. These are recorded counts; check the coverage notes before comparing periods.

The line joins consecutive published observations.

Knife-enabled crimes in Portsmouth (the council's broad local measure) · crimes
PeriodPortsmouth
2025/26–
2024/25826 crimes
2023/24862 crimes
2022/23742 crimes
2021/22811 crimes calculated

Calculated, not published: the figures marked “calculated” are the figure a report publishes for another year plus or minus the change it states. 2021/22: 742 + 69 (S22; S22 PDF page 17).

Shown as – : not available, and not zero. 2025/26 is not yet published in a Safer Portsmouth Partnership assessment.

Definition: All crimes the police flagged as involving a blade, plus crimes found by searching the crime summary text for blade, knife, knives, sword and machete. It covers all offence types and includes possession of a weapon (34% of the 2024/25 total). It is broader than the Home Office's national knife or sharp instrument measure, which counts only selected offences, and is not a count of stabbings, victims or injuries. 2021/22 to 2024/25 only.

  • These are crimes and incidents the police recorded, not prevalence. Many victims never report. National survey estimates are not published for Portsmouth and are not used here.
  • Counts are annual city totals. No ward, age or relationship breakdown is held in these figures.
  • Years are not interpolated or read from charts. Calculated values depend on the stated change and on the two editions using the same basis.
  • The partnership's assessments are the source; the underlying police extract has been requested (FOI-790-26-4400-02, tracker id police-da-knife) and may differ in definition.
  • Source files S16, S19, S22, S23 were read from the Internet Archive's copy of the same document because the council's site refuses scripted downloads; the file hashes are recorded.
  • Not comparable with the Home Office knife or sharp instrument rate for the force area (knife-offences-rate), which counts selected offences only.

Series breaks: 2021/22: Knife-enabled crime was first counted on this broad definition for 2021/22; before then, only knife-enabled serious violence was calculated (2022/23 assessment).

Residents of the council area admitted to any NHS hospital in England

Hospital admissions for violence, including sexual violence, per 100,000 residents

15.9 admissions per 100,000 residents (age-standardised) 2022/23 - 24/25

16 per 100,000 residents (age-standardised) lower than England (31.9).

Down 45 per 100,000 residents (age-standardised) since 2009/10 - 11/12 (60.6).

Administrative records

Trend, comparison and definition

What this answers: How often are Portsmouth residents admitted to hospital after an assault, compared with Southampton and England?

Hospital admissions for violence, including sexual violence, per 100,000 residents · admissions per 100,000 residents (age-standardised)
PeriodPortsmouthSouthamptonEngland
2022/23 - 24/2515.9 admissions per 100,000 residents (age-standardised)50.7 admissions per 100,000 residents (age-standardised)31.9 admissions per 100,000 residents (age-standardised)
2021/22 - 23/2417.4 admissions per 100,000 residents (age-standardised)51.7 admissions per 100,000 residents (age-standardised)34.2 admissions per 100,000 residents (age-standardised)
2020/21 - 22/2316.9 admissions per 100,000 residents (age-standardised)57 admissions per 100,000 residents (age-standardised)34.3 admissions per 100,000 residents (age-standardised)
2019/20 - 21/2217.8 admissions per 100,000 residents (age-standardised)60.6 admissions per 100,000 residents (age-standardised)38.4 admissions per 100,000 residents (age-standardised)
2018/19 - 20/2116 admissions per 100,000 residents (age-standardised)63.4 admissions per 100,000 residents (age-standardised)41.7 admissions per 100,000 residents (age-standardised)
2017/18 - 19/2016.4 admissions per 100,000 residents (age-standardised)64.1 admissions per 100,000 residents (age-standardised)45.5 admissions per 100,000 residents (age-standardised)
2016/17 - 18/1916.3 admissions per 100,000 residents (age-standardised)67.3 admissions per 100,000 residents (age-standardised)44.7 admissions per 100,000 residents (age-standardised)
2015/16 - 17/1820.2 admissions per 100,000 residents (age-standardised)68.6 admissions per 100,000 residents (age-standardised)43.2 admissions per 100,000 residents (age-standardised)
2014/15 - 16/1724.1 admissions per 100,000 residents (age-standardised)70.5 admissions per 100,000 residents (age-standardised)42.7 admissions per 100,000 residents (age-standardised)
2013/14 - 15/1633.4 admissions per 100,000 residents (age-standardised)75.4 admissions per 100,000 residents (age-standardised)44.6 admissions per 100,000 residents (age-standardised)
2012/13 - 14/1541.1 admissions per 100,000 residents (age-standardised)82.7 admissions per 100,000 residents (age-standardised)46.6 admissions per 100,000 residents (age-standardised)
2011/12 - 13/1451 admissions per 100,000 residents (age-standardised)91.7 admissions per 100,000 residents (age-standardised)51.5 admissions per 100,000 residents (age-standardised)
2010/11 - 12/1356.9 admissions per 100,000 residents (age-standardised)89 admissions per 100,000 residents (age-standardised)56.6 admissions per 100,000 residents (age-standardised)
2009/10 - 11/1260.6 admissions per 100,000 residents (age-standardised)89.3 admissions per 100,000 residents (age-standardised)61.7 admissions per 100,000 residents (age-standardised)

Definition: Emergency hospital admissions of residents where the cause of injury was recorded as assault (ICD-10 codes X85 to Y09), pooled over three financial years, per 100,000 residents, directly age-standardised so places with older or younger populations can be compared. Published by OHID from NHS Hospital Episode Statistics.

  • Only assaults serious enough for a hospital admission are counted; most violence never reaches hospital.
  • Counts depend on hospital staff recording assault as the cause of injury, so differences in recording between hospitals can affect comparisons.
  • Each value pools three years, so it changes slowly. The ranges shown are 95% confidence intervals.
  • Other comparison cities not shown: Chichester is part of West Sussex; this measure is only published for the whole county. Winchester is part of Hampshire; this measure is only published for the whole county.. A county figure is never shown in place of a city.

Police force area, not a city figure: Hampshire and Isle of Wight Constabulary covers Hampshire, Portsmouth, Southampton and the Isle of Wight (2,063,185 people at mid-2025; Portsmouth is about 10% of them). Portsmouth's own figure is not published for this measure.

Anti-social behaviour incidents recorded by the police per 1,000 residents (police force area)

8.9 incidents per 1,000 residents 2023/24

7.9 per 1,000 residents lower than England (16.9), calculated from unrounded figures.

Down 38 per 1,000 residents since 2011/12 (47.3).

Management information

Trend, comparison and definition

What this answers: How many anti-social behaviour incidents do the police record for every 1,000 residents in the Hampshire and Isle of Wight force area, compared with the South East and England?

Anti-social behaviour incidents recorded by the police per 1,000 residents (police force area)

2011/12 to 2023/24

Hampshire and Isle of Wight Constabulary area · incidents per 1,000 residents

Reviewed figures: 2011/12 to 2023/24.

Shown on this chart: From 2011/12 to 2023/24, anti-social behaviour incidents recorded by the police per 1,000 residents (police force area) fell by 81.2% in Hampshire and Isle of Wight Constabulary area and fell by 65.3% in England.

Both places compared over 2011/12 to 2023/24, using matching published dates.

Compared areas: Hampshire and Isle of Wight Constabulary area; English police forces, as published by ONS.

Actual values

Hampshire and Isle of Wight Constabulary areaEngland

Each line joins consecutive published observations for that place. Missing dates remain gaps.

Anti-social behaviour incidents recorded by the police per 1,000 residents (police force area) · incidents per 1,000 residents
PeriodHampshire and Isle of Wight Constabulary areaSussex police force areaLancashire police force areaHumberside police force areaSouth EastEngland
2023/248.9 incidents per 1,000 residents13 incidents per 1,000 residents32.9 incidents per 1,000 residents10.4 incidents per 1,000 residents10.8 incidents per 1,000 residents16.9 incidents per 1,000 residents
2022/2311 incidents per 1,000 residents11.6 incidents per 1,000 residents35.6 incidents per 1,000 residents12.4 incidents per 1,000 residents11.2 incidents per 1,000 residents17.1 incidents per 1,000 residents
2021/2214.6 incidents per 1,000 residents20.8 incidents per 1,000 residents44 incidents per 1,000 residents14.2 incidents per 1,000 residents15 incidents per 1,000 residents21.4 incidents per 1,000 residents
2020/2118.7 incidents per 1,000 residents33.6 incidents per 1,000 residents63.7 incidents per 1,000 residents21 incidents per 1,000 residents23 incidents per 1,000 residents34.1 incidents per 1,000 residents
2019/2016.6 incidents per 1,000 residents19.1 incidents per 1,000 residents37.9 incidents per 1,000 residents17.2 incidents per 1,000 residents16.4 incidents per 1,000 residents23 incidents per 1,000 residents
2018/1921.7 incidents per 1,000 residents20 incidents per 1,000 residents33.6 incidents per 1,000 residents18.2 incidents per 1,000 residents17.5 incidents per 1,000 residents24.3 incidents per 1,000 residents
2017/1825 incidents per 1,000 residents23.7 incidents per 1,000 residents47.5 incidents per 1,000 residents20.4 incidents per 1,000 residents20.8 incidents per 1,000 residents27.9 incidents per 1,000 residents
2016/1725.3 incidents per 1,000 residents24.5 incidents per 1,000 residents51.2 incidents per 1,000 residents19.5 incidents per 1,000 residents21.8 incidents per 1,000 residents31 incidents per 1,000 residents
2015/1623 incidents per 1,000 residents27.7 incidents per 1,000 residents52.3 incidents per 1,000 residents19.2 incidents per 1,000 residents22.9 incidents per 1,000 residents31.2 incidents per 1,000 residents
2014/1527.3 incidents per 1,000 residents32.2 incidents per 1,000 residents52 incidents per 1,000 residents20.9 incidents per 1,000 residents25.8 incidents per 1,000 residents34 incidents per 1,000 residents
2013/1431.4 incidents per 1,000 residents34.1 incidents per 1,000 residents57.2 incidents per 1,000 residents22.2 incidents per 1,000 residents27.6 incidents per 1,000 residents36.5 incidents per 1,000 residents
2012/1341.2 incidents per 1,000 residents37.7 incidents per 1,000 residents61.4 incidents per 1,000 residents23.7 incidents per 1,000 residents32.3 incidents per 1,000 residents40.3 incidents per 1,000 residents
2011/1247.3 incidents per 1,000 residents50.7 incidents per 1,000 residents68.1 incidents per 1,000 residents30.1 incidents per 1,000 residents40.5 incidents per 1,000 residents48.6 incidents per 1,000 residents

Definition: Anti-social behaviour incidents recorded by the police under the National Standard for Incident Recording in the financial year, per 1,000 residents, as published by ONS (Table P11). ONS's own rate, not recalculated here. Shown from 2011/12, the first comparable year.

  • These are incidents reported to the police, not crimes. ASB reported only to the council or a housing provider is not included.
  • ONS says these figures are not checked as closely as recorded crime and reflect what the police record, not the true level of ASB.
  • This is a police force figure for Hampshire, Portsmouth, Southampton and the Isle of Wight together. Street-level ASB reports for Portsmouth are on the site's police.uk map.
  • Other force areas are shown because a comparison city is in them. Each is a whole police force area, not that city.
  • Winchester, also a comparison city, is in the Hampshire and Isle of Wight force area too, so it has no separate force row.
  • ONS stopped publishing these figures by force after the year ending March 2024, so 2023/24 is the latest year.
  • 2020/21 stands out as higher than the years either side in both Hampshire and England, so avoid comparing a single year with it.

Series breaks: 2011/12: Police changed how ASB incidents were recorded from April 2011; ONS says earlier years are not directly comparable, so they are not shown.

What is being done

Official commitments only, with their status from dated evidence. A completed action is not proof the figures above improved.

  • In progress Health and Wellbeing Board (acting as the Safer Portsmouth Partnership): Reduce crime, anti-social behaviour and harm over three years through four priorities: tackling violent crime (including violence against women and girls and knife crime), reducing drug harm, supporting young people at risk and helping people with complex needs. evidence 2026-09-23 ↗
  • Not verified Safer Portsmouth Partnership: Run a Young Futures panel pilot for children aged 10 to 17 at risk of involvement in crime, linking them to positive activities and role models. document ↗
  • Approved Police and Crime Commissioner for Hampshire and the Isle of Wight: Commission partner agency interventions to tackle anti-social behaviour, and hold the Chief Constable to account for tackling it. evidence 2024-11-01 ↗
  • Not verified Police and Crime Commissioner for Hampshire and the Isle of Wight: Fund the recruitment of additional police officers, increase the number of Local Bobbies and open more police stations and front counters. document ↗
  • Funded Police and Crime Commissioner for Hampshire and the Isle of Wight, with Portsmouth City Council: Fund extra community wardens, youth outreach and patrols in anti-social behaviour hotspots in Portsmouth (£150,000 of a £750,000 force-wide release). evidence 2024-08-28 ↗
  • Approved Portsmouth City Council (Full Council): Deliver four schemes added to the 2026/27 capital programme: a raised zebra crossing on Lawrence Road, traffic calming on Highbury Grove, five deployable CCTV cameras for Charles Dickens ward and more accessible play equipment. evidence 2026-02-24 ↗
  • Proposed Portsmouth City Council (Cabinet, for Full Council): Adopt the Youth Justice Strategic Plan and its priorities for reducing offending and reoffending by children, with final approval by Full Council. evidence 2026-10-27 ↗
  • Approved Hampshire and Isle of Wight Fire and Rescue Authority: Deliver the Safety Plan (community risk management plan) from 1 April 2025 to 31 March 2030. It names no Portsmouth-specific service changes; it identifies very high dwelling-fire risk areas, mainly in the cities. evidence 2025-02-12 ↗

Trend, commitments and gaps for this issue →

Who can act

  • Hampshire and Isle of Wight Constabulary — The police force for Portsmouth: responds to and records crime, investigates and works on prevention with local partners.
  • Police and Crime Commissioner for Hampshire and the Isle of Wight — Elected to set the police and crime plan and budget, hold the Chief Constable to account and commission victim services.
  • Safer Portsmouth Partnership — Portsmouth's statutory community safety partnership: brings local organisations together to reduce crime, anti-social behaviour, substance misuse and reoffending, and publishes the city's community safety strategic assessment.
  • Portsmouth City Council — A responsible authority in the community safety partnership; deals with anti-social behaviour reports and case reviews, signposts domestic abuse support and runs public health for the city.

See what could change in Portsmouth → · Your councillors and MPs →

Support & Services

What we couldn’t find yet (8)

These figures would help residents but are not published for Portsmouth in a form we can check and refresh automatically.

  • Latest PEEL 2025–27 inspection grades for Surrey Police and Wiltshire Police. Both reports were published in April 2026, but their files on the inspectorate's public file store carry a reference number that could not be found, and the inspectorate's web pages block automated requests. Their 2023–25 grades are shown instead and are not the latest. Read on the inspectorate's website: hmicfrs.justiceinspectorates.gov.uk/peel-reports/surrey-2025-27/ and /peel-reports/wiltshire-2025-27/. Add the PDF file names to the fetcher to include them.
  • PEEL 2014 grades and the PEEL 2015 efficiency grade for Hampshire Constabulary. The report files could not be found on the inspectorate's public file store under any name tried, and the inspectorate's web pages block automated requests. Historic PEEL pages on hmicfrs.justiceinspectorates.gov.uk (peel-assessments/peel-2014/hampshire/ and peel-2015/hampshire/), or ask the Office of the Police and Crime Commissioner for Hampshire and the Isle of Wight.
  • Domestic abuse by ward, and for Portsmouth before 2011/12, in 2017/18 and for 2025/26. Annual Portsmouth totals for 2011/12 to 2024/25 are now shown (2017/18 excepted), from the council's assessments. ONS and the Home Office still publish domestic abuse only by police force area, and no ward, age or relationship breakdown, nor any year before 2011/12, was found. It could be requested under the Freedom of Information Act: Freedom of Information request to Hampshire and Isle of Wight Constabulary already sent (9 November 2026, reference FOI-790-26-4400-02, tracker id police-da-knife): await the reply. A clarification asking for the earlier years and the spreadsheet behind the council's Figure 4.1 is drafted but unsent; the council's csresearchers@portsmouthcc.gov.uk team holds that spreadsheet.
  • Knife or sharp instrument offences for Portsmouth on the national definition, and knife-enabled crime before 2021/22. The council's broad local count of knife-enabled crimes is now shown for 2021/22 to 2024/25. It is a different, wider measure than the Home Office national definition, which is published only by police force area, and the council did not calculate it before 2021/22. It could be requested under the Freedom of Information Act: Covered by the Freedom of Information request already sent to Hampshire and Isle of Wight Constabulary (FOI-790-26-4400-02, tracker id police-da-knife): await the reply and compare its definition with the council's.
  • Anti-social behaviour incidents by force after March 2024, and for Portsmouth alone. ONS dropped ASB incidents from its police force area tables after the year ending March 2024 and never published them by council area. Street-level ASB reports for Portsmouth are published monthly on police.uk (already on this site's crime map, with approximate locations). Council-held ASB case data would need an FOI to Portsmouth City Council.
  • Domestic abuse-related crime before 2018/19. The ONS data tools for years ending March 2016 to 2018 are published only as older .xls workbooks, which this standard-library fetcher does not read. ONS Domestic abuse in England and Wales data tool editions for 2016 to 2018 (same ONS dataset page). Note that domestic abuse incident data before April 2015 are not comparable.
  • Crime Survey (victimisation) estimates for Portsmouth. The Crime Survey for England and Wales sample is too small for city estimates; ONS publishes a few measures by police force area only. No route to an official Portsmouth survey estimate. Force-area survey tables are in the ONS police force area data tables.
  • Hospital admissions for assault with a sharp object in Portsmouth. Published for England and Wales only (ONS appendix Table B8). NHS England Hospital Episode Statistics data access request, or ask Portsmouth public health (Portsmouth City Council) for the local violence needs assessment.
Sources and method

Comparison places are chosen automatically: the three nearest official cities, and the three most similar cities in the ONS area classification (cities whose council areas have a similar population make-up), plus England. Where a measure is only published for whole counties, cities inside a county are left out rather than replaced by the county.

Figures are fetched by a script from the official source and shown unchanged. Comparisons use the same definition and period for every place. Rates and shares change in percentage points; counts and levels change in per cent. An increase is not automatically good or bad.

All the data in this topic

The retained source collection contains 5 records for this topic, including comparison areas and older releases. Each record keeps its own period and source date. Current findings above may use newer releases; a later page update does not refresh every record.

Browse 1 measures and their sources
Police-recorded crime rate
Police-recorded crime rate · retained published records
Area and periodFigureDefinition, source and limits
Southampton
Year ending March 2026
120.1

Police-recorded crime excluding fraud, not all crime. ONS-published rate uses mid-2024 population. Some Hampshire offences cannot be assigned to a local authority. Comparators are selected coastal authorities, not a statistical peer group.

ONS / Home Office ↗Source retrieved 2026-10-03
Portsmouth
Year ending March 2026
112.7

Police-recorded crime excluding fraud, not all crime. ONS-published rate uses mid-2024 population. Some Hampshire offences cannot be assigned to a local authority. Comparators are selected coastal authorities, not a statistical peer group.

ONS / Home Office ↗Source retrieved 2026-10-03
Brighton and Hove
Year ending March 2026
99.8

Police-recorded crime excluding fraud, not all crime. ONS-published rate uses mid-2024 population. Some Hampshire offences cannot be assigned to a local authority. Comparators are selected coastal authorities, not a statistical peer group.

ONS / Home Office ↗Source retrieved 2026-10-03
Plymouth
Year ending March 2026
93.1

Police-recorded crime excluding fraud, not all crime. ONS-published rate uses mid-2024 population. Some Hampshire offences cannot be assigned to a local authority. Comparators are selected coastal authorities, not a statistical peer group.

ONS / Home Office ↗Source retrieved 2026-10-03
England
Year ending March 2026
83.4

Police-recorded crime excluding fraud, not all crime. ONS-published rate uses mid-2024 population. Some Hampshire offences cannot be assigned to a local authority. Comparators are selected coastal authorities, not a statistical peer group.

ONS / Home Office ↗Source retrieved 2026-10-03

Source downloads and methods →