10.77%
Share of properties in mapped river/sea flood-risk areas
% · June 2026
Includes every mapped likelihood band, including very low. Denominator is all NRD 2023 properties in the local authority, including non-residential properties. Modelled risk with defences; not a prediction that this percentage will flood.
Environment Agency
Definition and evidence →
27.97 µg/m³
NO₂ annual mean — London Road
µg/m³ · 2025 · London Road automatic monitoring station
A measured concentration at this monitoring station, not a citywide average. Gatcombe Park is the urban-background station; other stations represent roadside or kerbside conditions.
Portsmouth City Council
Definition and evidence →
19.08 µg/m³
PM10 annual mean — London Road
µg/m³ · 2025 · London Road automatic monitoring station
A measured concentration at this monitoring station, not a citywide average. Gatcombe Park is the urban-background station; other stations represent roadside or kerbside conditions.
Portsmouth City Council
Definition and evidence →
11.61 µg/m³
PM₂.₅ annual mean — London Road
µg/m³ · 2025 · London Road automatic monitoring station
A measured concentration at this monitoring station, not a citywide average. Gatcombe Park is the urban-background station; other stations represent roadside or kerbside conditions.
Portsmouth City Council
Definition and evidence →
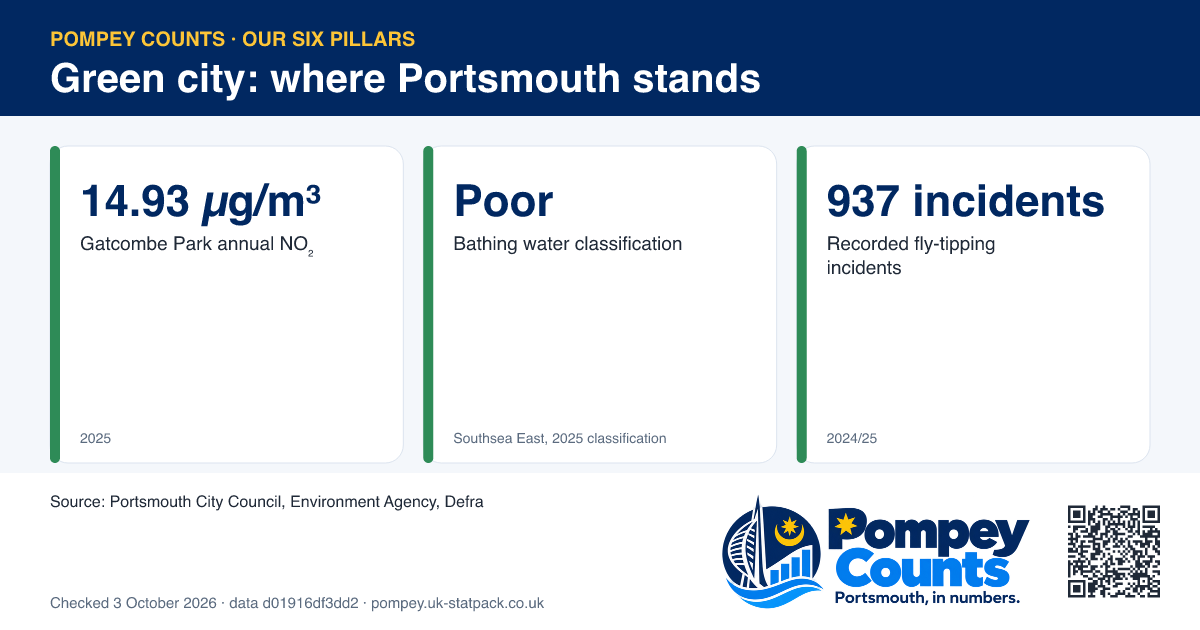
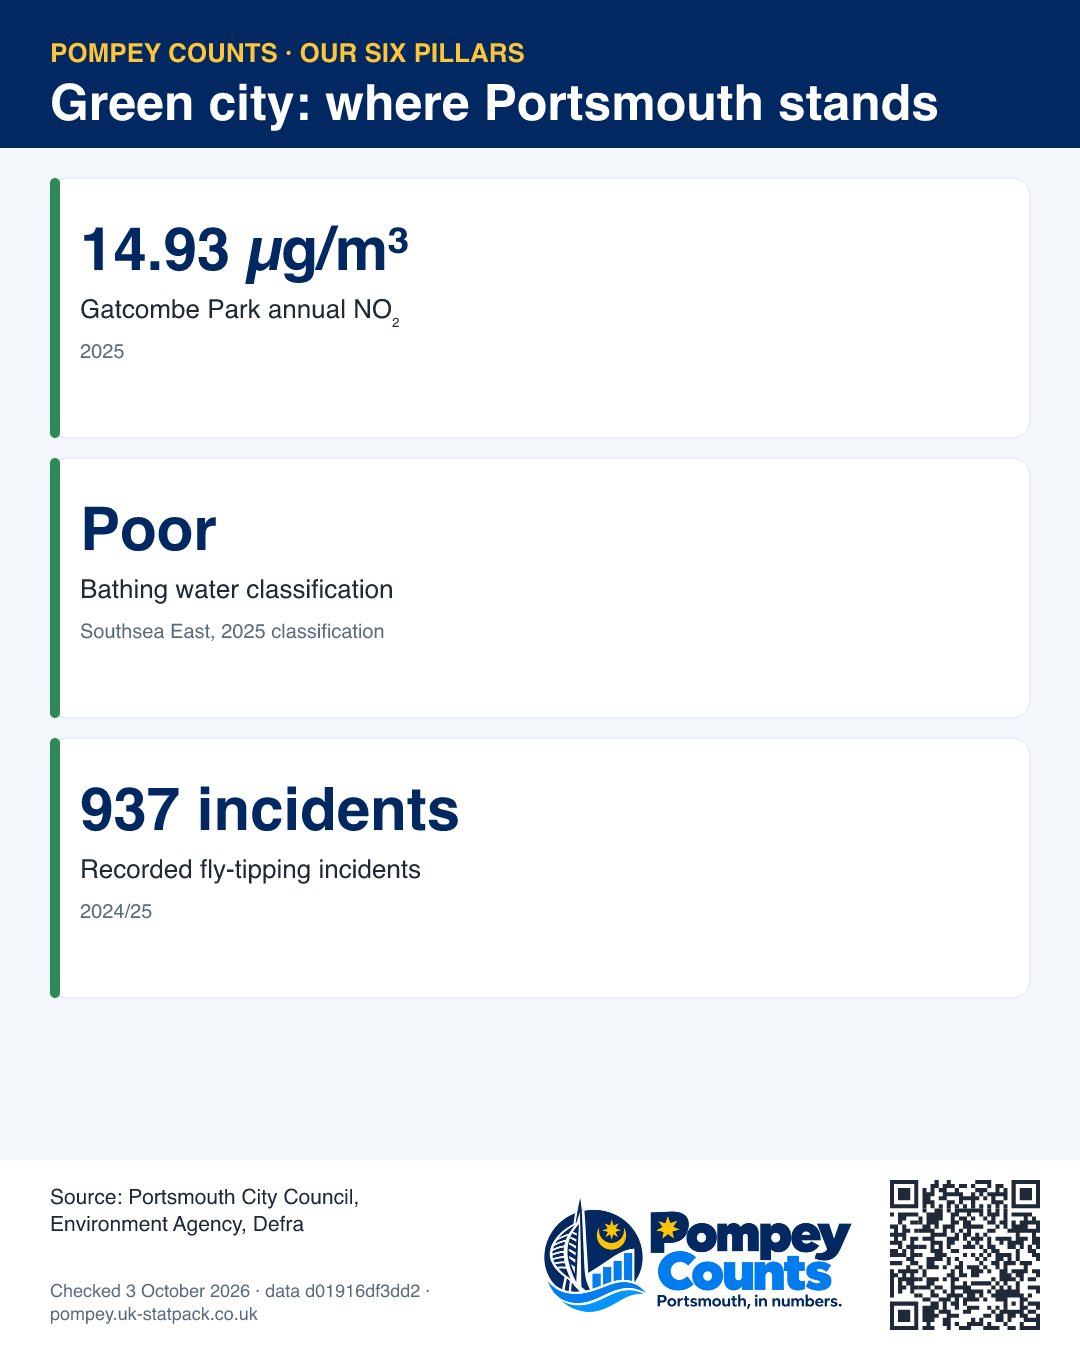
14.93 µg/m³
NO₂ annual mean — Gatcombe Park
µg/m³ · 2025 · Gatcombe Park automatic monitoring station
A measured concentration at this monitoring station, not a citywide average. Gatcombe Park is the urban-background station; other stations represent roadside or kerbside conditions.
Portsmouth City Council
Definition and evidence →
13.91 µg/m³
PM10 annual mean — Gatcombe Park
µg/m³ · 2025 · Gatcombe Park automatic monitoring station
A measured concentration at this monitoring station, not a citywide average. Gatcombe Park is the urban-background station; other stations represent roadside or kerbside conditions.
Portsmouth City Council
Definition and evidence →